 Software Is Nothing
Worked case · synthetic data · 2026
Following one failed unit through a factory's data
One optical instrument fails final inspection on the line, and the question is simple: why, and what does it cost. That question cannot be answered on the day it happens, because the answer for one unit is split across the machine stations, three hand stations, two generations of an ERP, the dealer, the owner's own registration and the service desk, and no two of those systems share a key. Everything below is downstream of that single failure, followed in the order one real unit actually travels, built on synthetic data shaped to match.
Spoken walkthrough
Listen: a 34-minute spoken walkthrough of this page, in my voice. Recorded with a local text-to-speech model from a script I wrote.
Read the transcript
This is Matthew Perry. What you are about to hear is a full spoken walk through of a business case built around one line on the page: one unit fails final inspection, and everything after that is the same problem. I will take you through what was actually built, what was modelled to keep the engineering realistic, and what each number means, moving in the order the page presents it, from the first failed inspection out through the field and back to the people behind it.
Every figure you will hear is synthetic. It was generated for this exercise, and none of it describes any real company's operations. This narration runs about thirty five minutes. Here is the page.
So here is the top of it, starting with the headline: one unit fails final inspection. Everything after that is the same problem. This is part two of two, the business case, built from what you told me, using synthetic data throughout.
Here's the setup. A binocular fails final inspection on the line, and the question is simple: why, and what does it cost us. You can't answer that on the day it happens, because the answer for that one unit is split across the machine stations, three hand stations, two generations of an E R P, the dealer, the owner's own registration, and the service desk. No two of those systems share a key. Everything on the page follows that single failure downstream, in the order a real unit actually travels, built on synthetic data shaped to match.
Right under that sits the synthetic data banner. Every figure here is synthetic. I generated four datasets for this exercise, shaped like an E R P, a C R M, a quality control station log, and a web analytics feed. No real customer, dealer, serial number, campaign, or inspection is used, reproduced, or implied anywhere, and nothing describes any company's actual operations. The volumes are order of magnitude estimates, chosen to make the engineering realistic.
Then comes the section called what you told me: the pieces of one problem. It takes six things you said, in your own words, and maps each to what it actually is underneath, and where on the page I answer it. Nobody can say why products fail quality control, that's failure reasons captured three ways, some by hand, none coded. Needing two systems to answer one question, that's the E R P and the C R M disagreeing on the key that should join them.
Production data being a live issue right now, that's the two E R P generations, a firehose of station events, late arrivals, replays, and the renamed column. How much is done by hand versus by a system becomes a capture method column on every record, then it's a number.
Then there's ranking what's highest value for the least effort, and formalizing what done actually means. I used generic names on purpose, the E R P, the C R M, the legacy system, because the engineering is identical whichever vendor sits behind them. These aren't six separate problems. They're one failure, seen from six different desks.
Next, the section called one dataset, one thread.
Everything here comes from eleven synthetic tables I built, grouped into three slices: production, product, and people. The idea: one serial number threads a single unit from its work order out to the field, and where there is no serial, an email address threads a person from a web form into the C R M, the customer relationship management system. Nothing actually forces that thread to hold. Every system just writes its own spelling of the same key.
Take one example serial from the synthetic set. Manufacturing writes it as S W dash E L four two one zero dash zero zero zero zero one two three. The dealer shortens it to E L four two one zero dash one two three. The customer's own registration types it lowercase with spaces. The service desk drops the punctuation entirely. Four systems, four spellings, one unit.
On top of that, I baked in more traps on purpose: stripped leading zeros, typos, duplicate registrations, timestamps with no time zone, dealers who report late or never, a file format that changed overnight, failure reasons written in three languages, duplicate event batches from replays, a column renamed mid year, and five hundred and sixteen registrations dated before their own unit was even built.
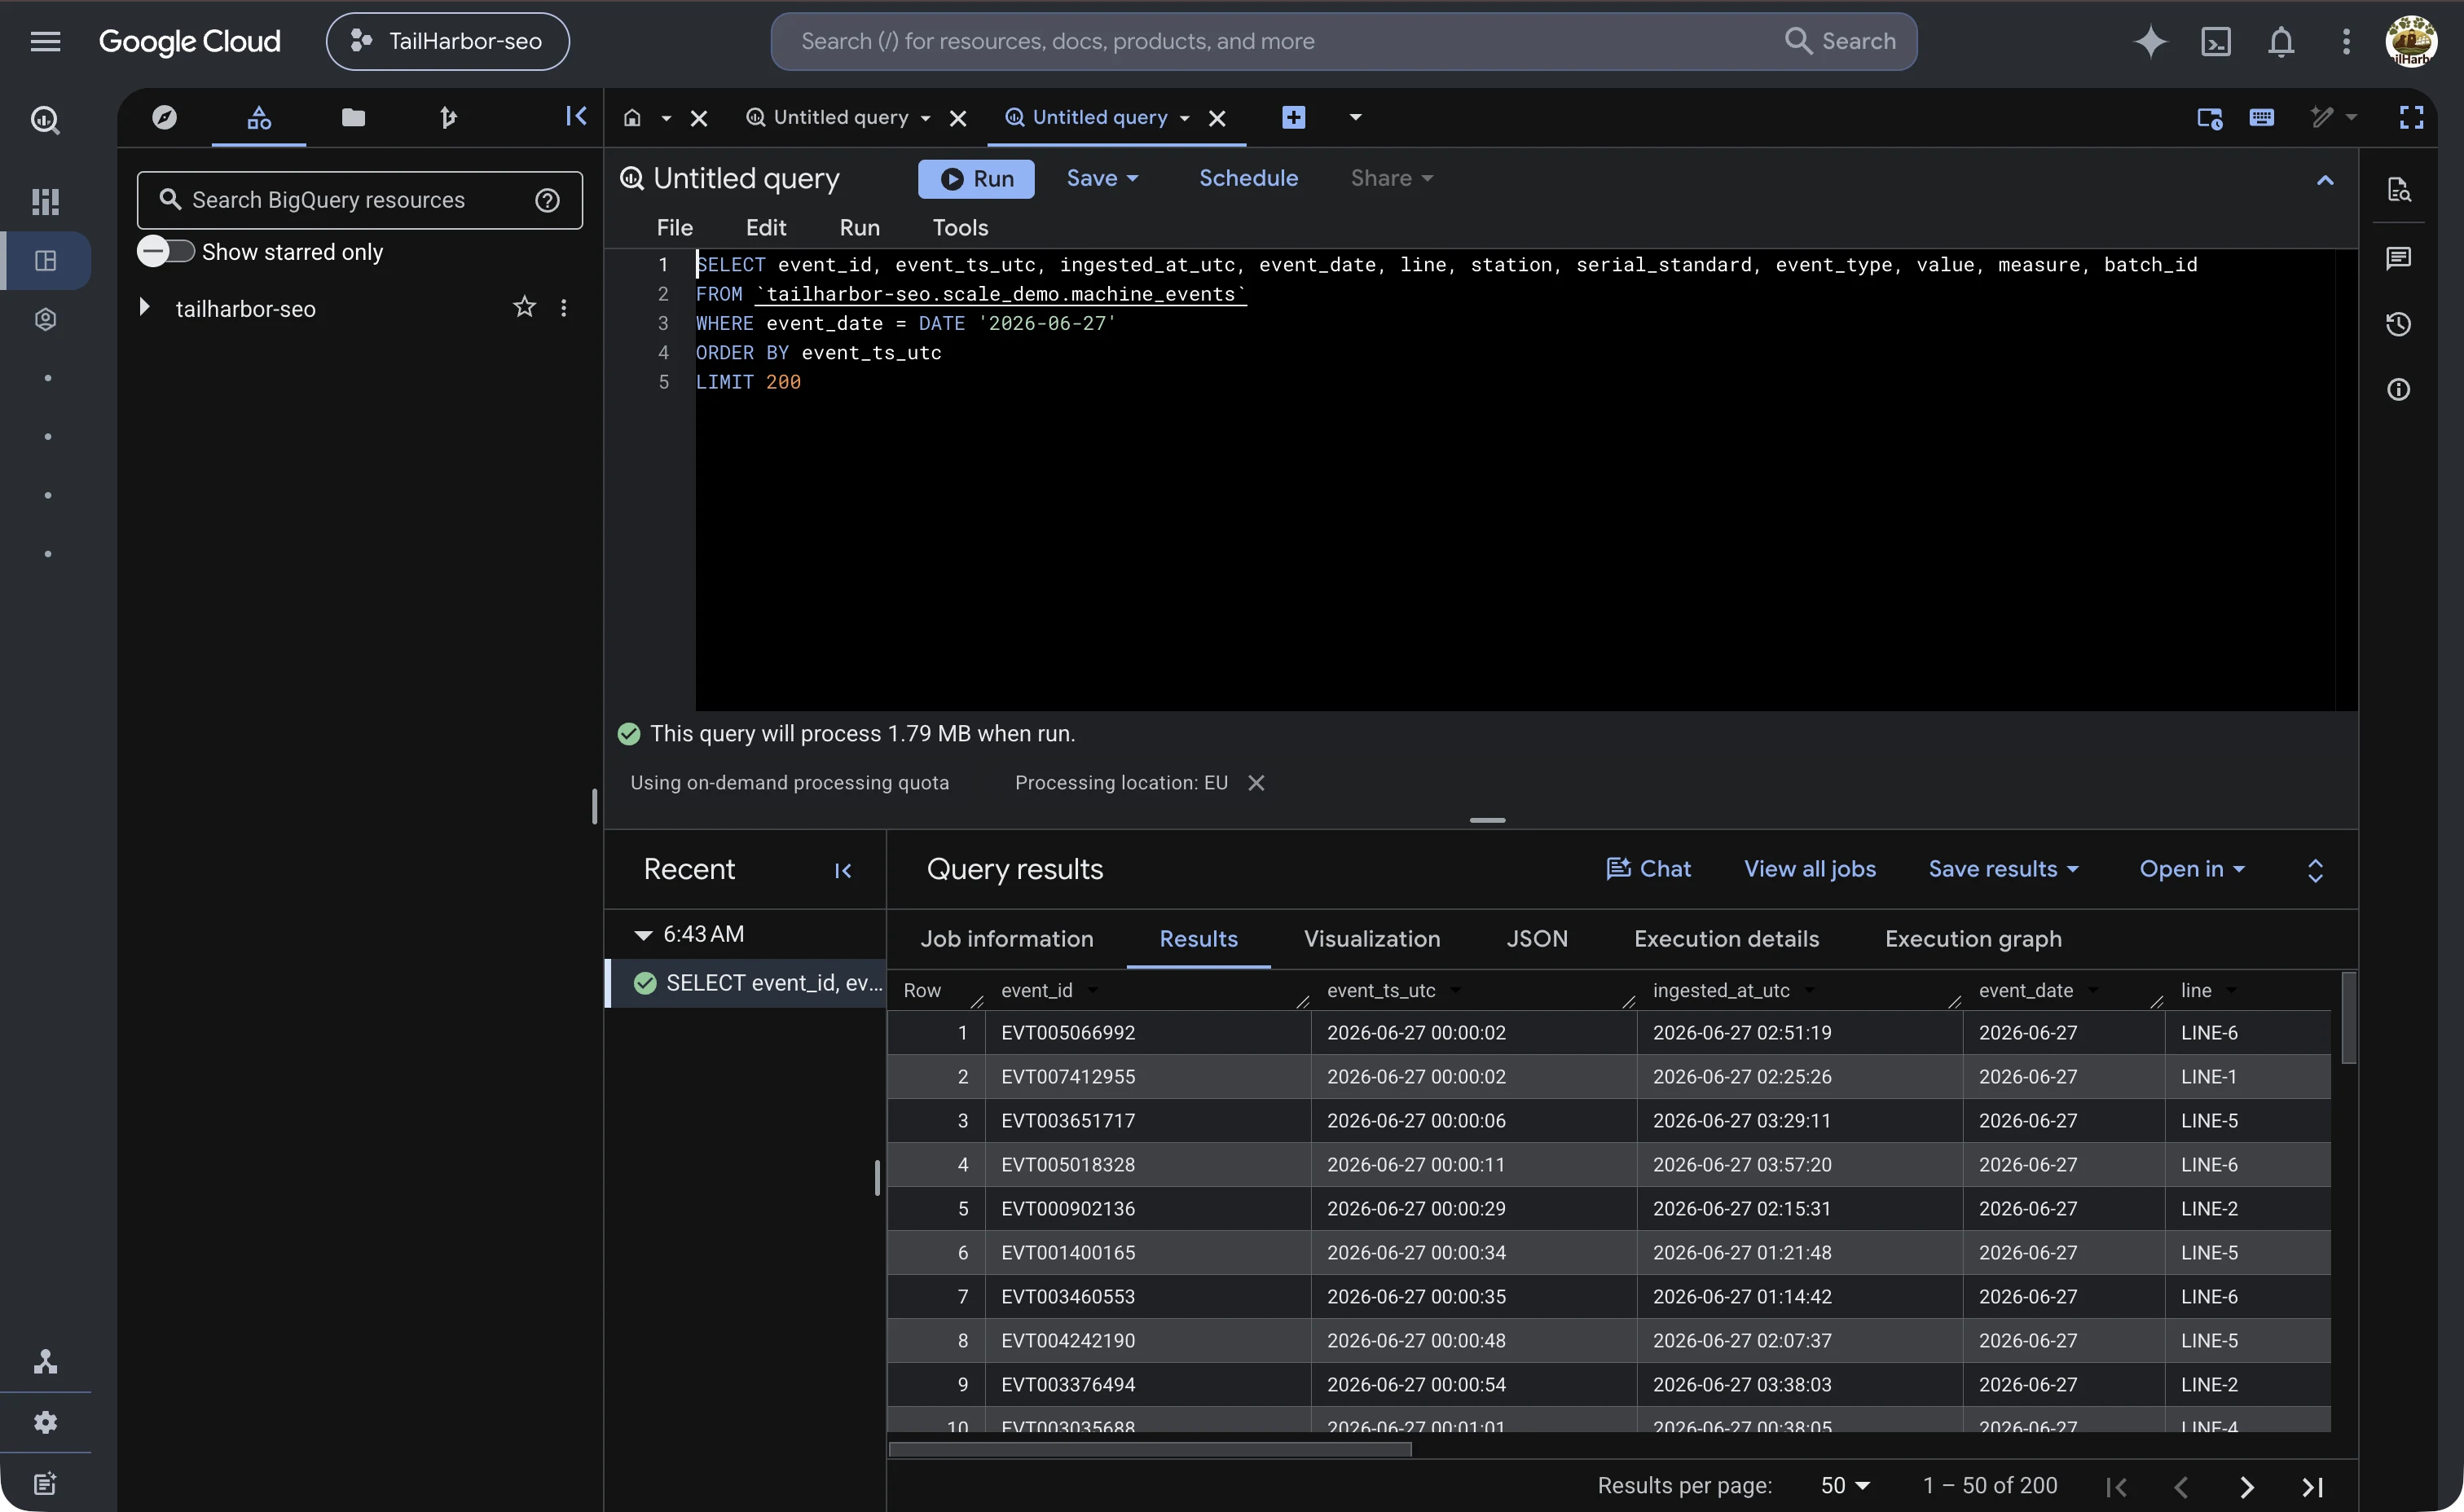
The figure next to this section is a plain screenshot from BigQuery, the data warehouse: one day of raw station events, pulled straight off the table, with eight and a half million rows behind it, all of it synthetic. Already, on the very first row, the ingested at timestamp is two hours behind when the event actually happened. That is the starting mess. Everything after this is what it takes to clean it up.
Next, the section called the unit. This is the one row I follow all the way through, because everything else on this page is downstream of what happens to it. It comes from the synthetic dataset, and every table it moves through is synthetic too, but the kind of gap it exposes is real. The serial is S W dash E L thirty two ten dash zero two nine seven seven zero seven. I will just call it our serial from here on. It is an E L Range binocular, for the birding segment, list price two thousand eight hundred and ninety euros.
Before that serial exists there are two lots, a lens lot and a housing lot. The lens lot is recorded three times, once each by the grinding machine, the interferometer, and the coating line. The housing lot is recorded three times too, two of those by machines and one by a person hand finishing it. Neither lot knows a serial yet, because there is not one.
The serial gets written for the first time on the sixth of February twenty twenty one, at clean room assembly. That is the moment the two lots become one physical unit, and a person writes the serial by hand into the unit inspection log and the lot to serial table that ties it back to where it came from.
That same afternoon the unit fails final inspection. The inspector types a misspelling of the word scratch, no catalogue code, and logs the row an hour and a half late. It goes back to assembly, comes forward, fails again three days later for a focus problem, goes back a second time for glue residue, and passes on its third attempt. Six hand written rows, five operator initials, three free text reasons matching nothing in the catalogue as typed. The station clock through all of this reads New York time.
Then the unit leaves the factory. A dealer in Germany sells it in October twenty twenty one and reports the sale seven days late, spelling the serial one way. The owner registers it on the web a month later, from the Canadian subsidiary, spelling it a second way. The service desk in Canada logs a warranty repair, and later a paid cleaning, spelling it a third way. Four systems, four spellings, one unit, one border crossed, and a warranty case on a unit already reworked twice before it left the building. Every section after this one is another place that same gap shows up.
Next, the section called at the station: why it failed.
This is where our unit failed, and the plain problem is that nobody could say why, because the reason for a failure gets written down three different ways.
I built this on six hundred and eighty three thousand two hundred and ninety two inspection rows across eight stations, from lens grinding through to final inspection. Five are machines: grinding, the interferometer check, coating, housing machining, and anodizing. Three are hand stations: housing hand finishing, clean room assembly, and final inspection, where our unit actually failed. The station roles here are synthetic too, sized to keep the engineering realistic.
Across all eight, the overall fail rate is four percent. But ninety two point six percent of the rows were typed by a person. That's not because most of the line is manual, it's because a machine station logs one row per lot of lenses or housings, while a hand station logs one row per unit, and units far outnumber lots. That share is a function of record grain, not of how many stations are automated, and once that column exists, how much is done by hand is a query, not a debate.
Now the reason itself. A machine station writes a code. A hand station writes what the inspector saw, in whichever language came first: dust, or Staub, or Fingerabdruck. Group by the raw string and one failure splinters into a dozen spellings, and the dashboard just says other.
Four steps fix that. First, a reason catalogue: one code per known cause, per station, forty eight phrasings collapsing into thirty two codes. Second, map, don't guess: a phrase that matches becomes a code, one that doesn't stays flagged, and four thousand five hundred and ninety three of twenty seven thousand two hundred and seventy nine fails landed flagged. Third, remove the double entries: the same serial, station and minute logged twice by hand is one failure, not two, twelve thousand four hundred and sixty six duplicates removed. Fourth, carry a capture method column, hand or system, on every row.
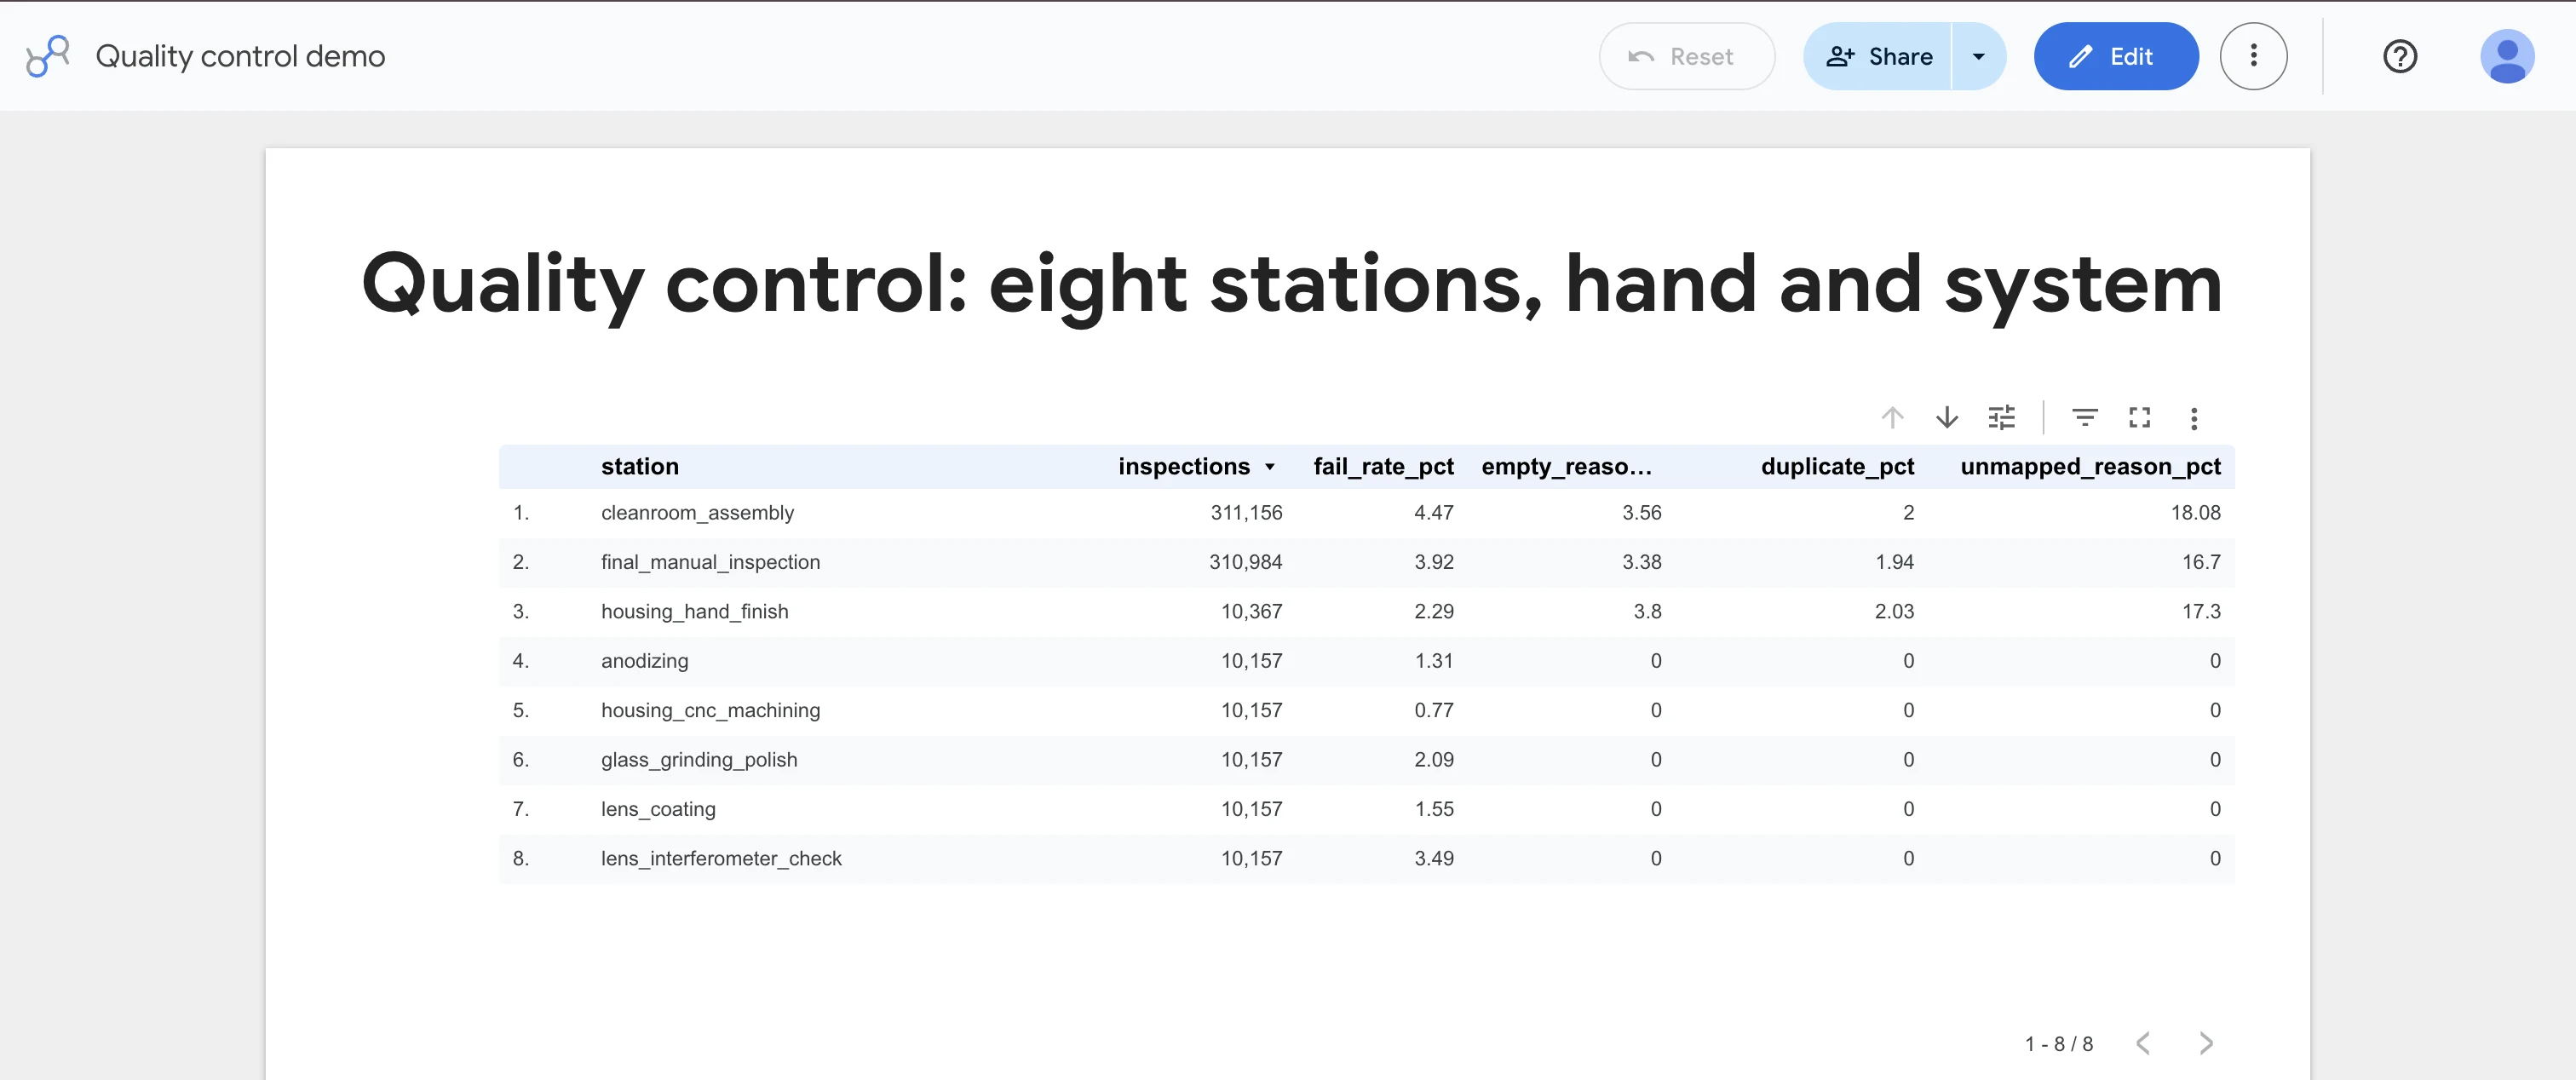
The station table shows it clearly. On the five machine stations, empty reasons, duplicates and unmatched reasons all sit at zero. On the three hand stations, unmatched reasons range from sixteen point seven percent at final inspection to eighteen point one percent at clean room assembly, duplicates hold close to two percent, and three to four percent of rows carry no reason at all, station by station rather than blended away.
Then the part that actually costs money: the field link. A reworked unit turns up in service afterward at two point four six times the rate of a unit that passed first time, ten percent of ten thousand five hundred and twenty nine reworked units, against four point one percent of two hundred eighty two thousand two hundred and twenty nine that passed first time. That comparison only exists because the inspection log joins to service history on the serial number, and repairing that join is exactly the work waiting in the section called out the door, further along.
Without it, this number is zero. All four figures in this section, the fail rate, the hand written share, the unmatched reason share, and the field service ratio, are synthetic.
Three mistakes, all mine, none of which threw an error. A join checking a hand typed serial against the manufacturing table forgot to strip the brand prefix first, so it matched nothing, caught by counting matches per side. The catalogue itself listed spellings that collapse to the same key once lower cased, so the join fanned rows out and inflated every hand station's count by three to four percent, caught by checking the view's row count against the sum of its tables. And the routine simulating a mistyped zero could pick a position that was never actually a zero, which nothing can undo afterward: one point one percent of serials were unrecoverable until it was restricted to real zeros.
Prevention is two changes. Give the inspector a coded picklist at the station, with a free text note still there for the engineer to read. And put a capture method column on every record, everywhere, so this answer is always one query away.
Next, the section called downstream zero two: upstream, which lot, which order, and two E R P systems that disagree. To blame a lot for a fail, you need the work order behind it, and that order lives in two systems that don't even agree on what the order is.
Here's what's real about the setup, modeled on purpose. These figures are synthetic, measured on the loaded dataset. The old E R P writes a work order as a ten digit string with leading zeros, item numbers the same way, dates as plain year month day text, and it sends a full dump once a month. The new one writes the same order as a change feed of inserts, updates, and deletes, with a dash in the key instead of padded zeros. Same order, two shapes.
Matching them on the raw key catches nothing, zero matched against fifty three thousand, five hundred seventy one left over. Strip the zeros, add the prefix back, run the item numbers through a crosswalk, and twenty five thousand five hundred match, twenty eight thousand seventy one still don't.
Those last ones are orders that closed before the new system ever existed, so I kept them as legacy only in the view instead of dropping them. Of the twenty five thousand five hundred both systems know about, two thousand four hundred sixty four disagree on quantity or status. The view carries a source of truth column with three values, legacy only, new, and conflict, so a disagreement gets shown rather than silently resolved by picking whichever system I trust more.
Then there's the event stream underneath all of it, eight and a half million station and machine readings loaded, partitioned by day and clustered by line. Of the eight point two million events left after duplicates are merged out, twelve point nine percent arrive one to three days after they actually happened, delayed by the generator on purpose.
On the worst single day, a count taken at midnight only caught eleven thousand five hundred seventy two of the thirteen thousand four hundred eleven events that eventually showed up for that day, fifteen point eight percent short. Close the count at midnight and it's wrong. Close it with a three day watermark and it's right, three days later. The dashboard has to say which one it's showing.
Those events land in a staging table and get merged into the main one on their event I D, and I built the flow to run that merge twice on purpose, checking that the second pass inserts nothing. The first run inserted eight million, two hundred forty five thousand, eight hundred thirty five rows. The second inserted zero. That check is what makes a retry safe at three in the morning.
On the first of October twenty twenty five, the station software renamed its reading column from value to measure, mid year, exactly the kind of thing that breaks a naive pipeline. Three million, eight hundred sixteen thousand, five hundred eighty two rows before that date only have value; four million, six hundred eighty three thousand, four hundred eighteen after only have measure. The view reads whichever column is populated, and flags any row where both are empty instead of quietly reporting it as zero.
Then the cost table. Counting one day by converting every timestamp to a date scans one hundred seventy eight point five megabytes. Filtering on the partition column instead scans eleven hundredths of a megabyte, one thousand six hundred times less. Add a cluster filter for one line and it's twenty two hundredths of a megabyte, because the engine also has to read the cluster column. The warehouse bills a ten megabyte minimum per query, so the actual billed gap is seventeen times, not one thousand six hundred, and partitioning gets decided when the table is created, not later.
Two mistakes here, both caught before anything loaded. First, the generator writing the monthly legacy dump crashed on its second pass because I'd handed a date object to a function expecting a string, a one line fix, but it would have shipped a half written dump. Second was a definition problem, not a bug: the generator delays five percent of events on purpose, yet the measured late share came out at twelve point nine percent, because a calendar day comparison also counts a two hour lag that happens to cross midnight as late. I left the number as measured and wrote the definition next to it, because any real dashboard comparing dates instead of timestamps will hit the same thing.
Next, the section called out the door: the serial that four systems write four ways.
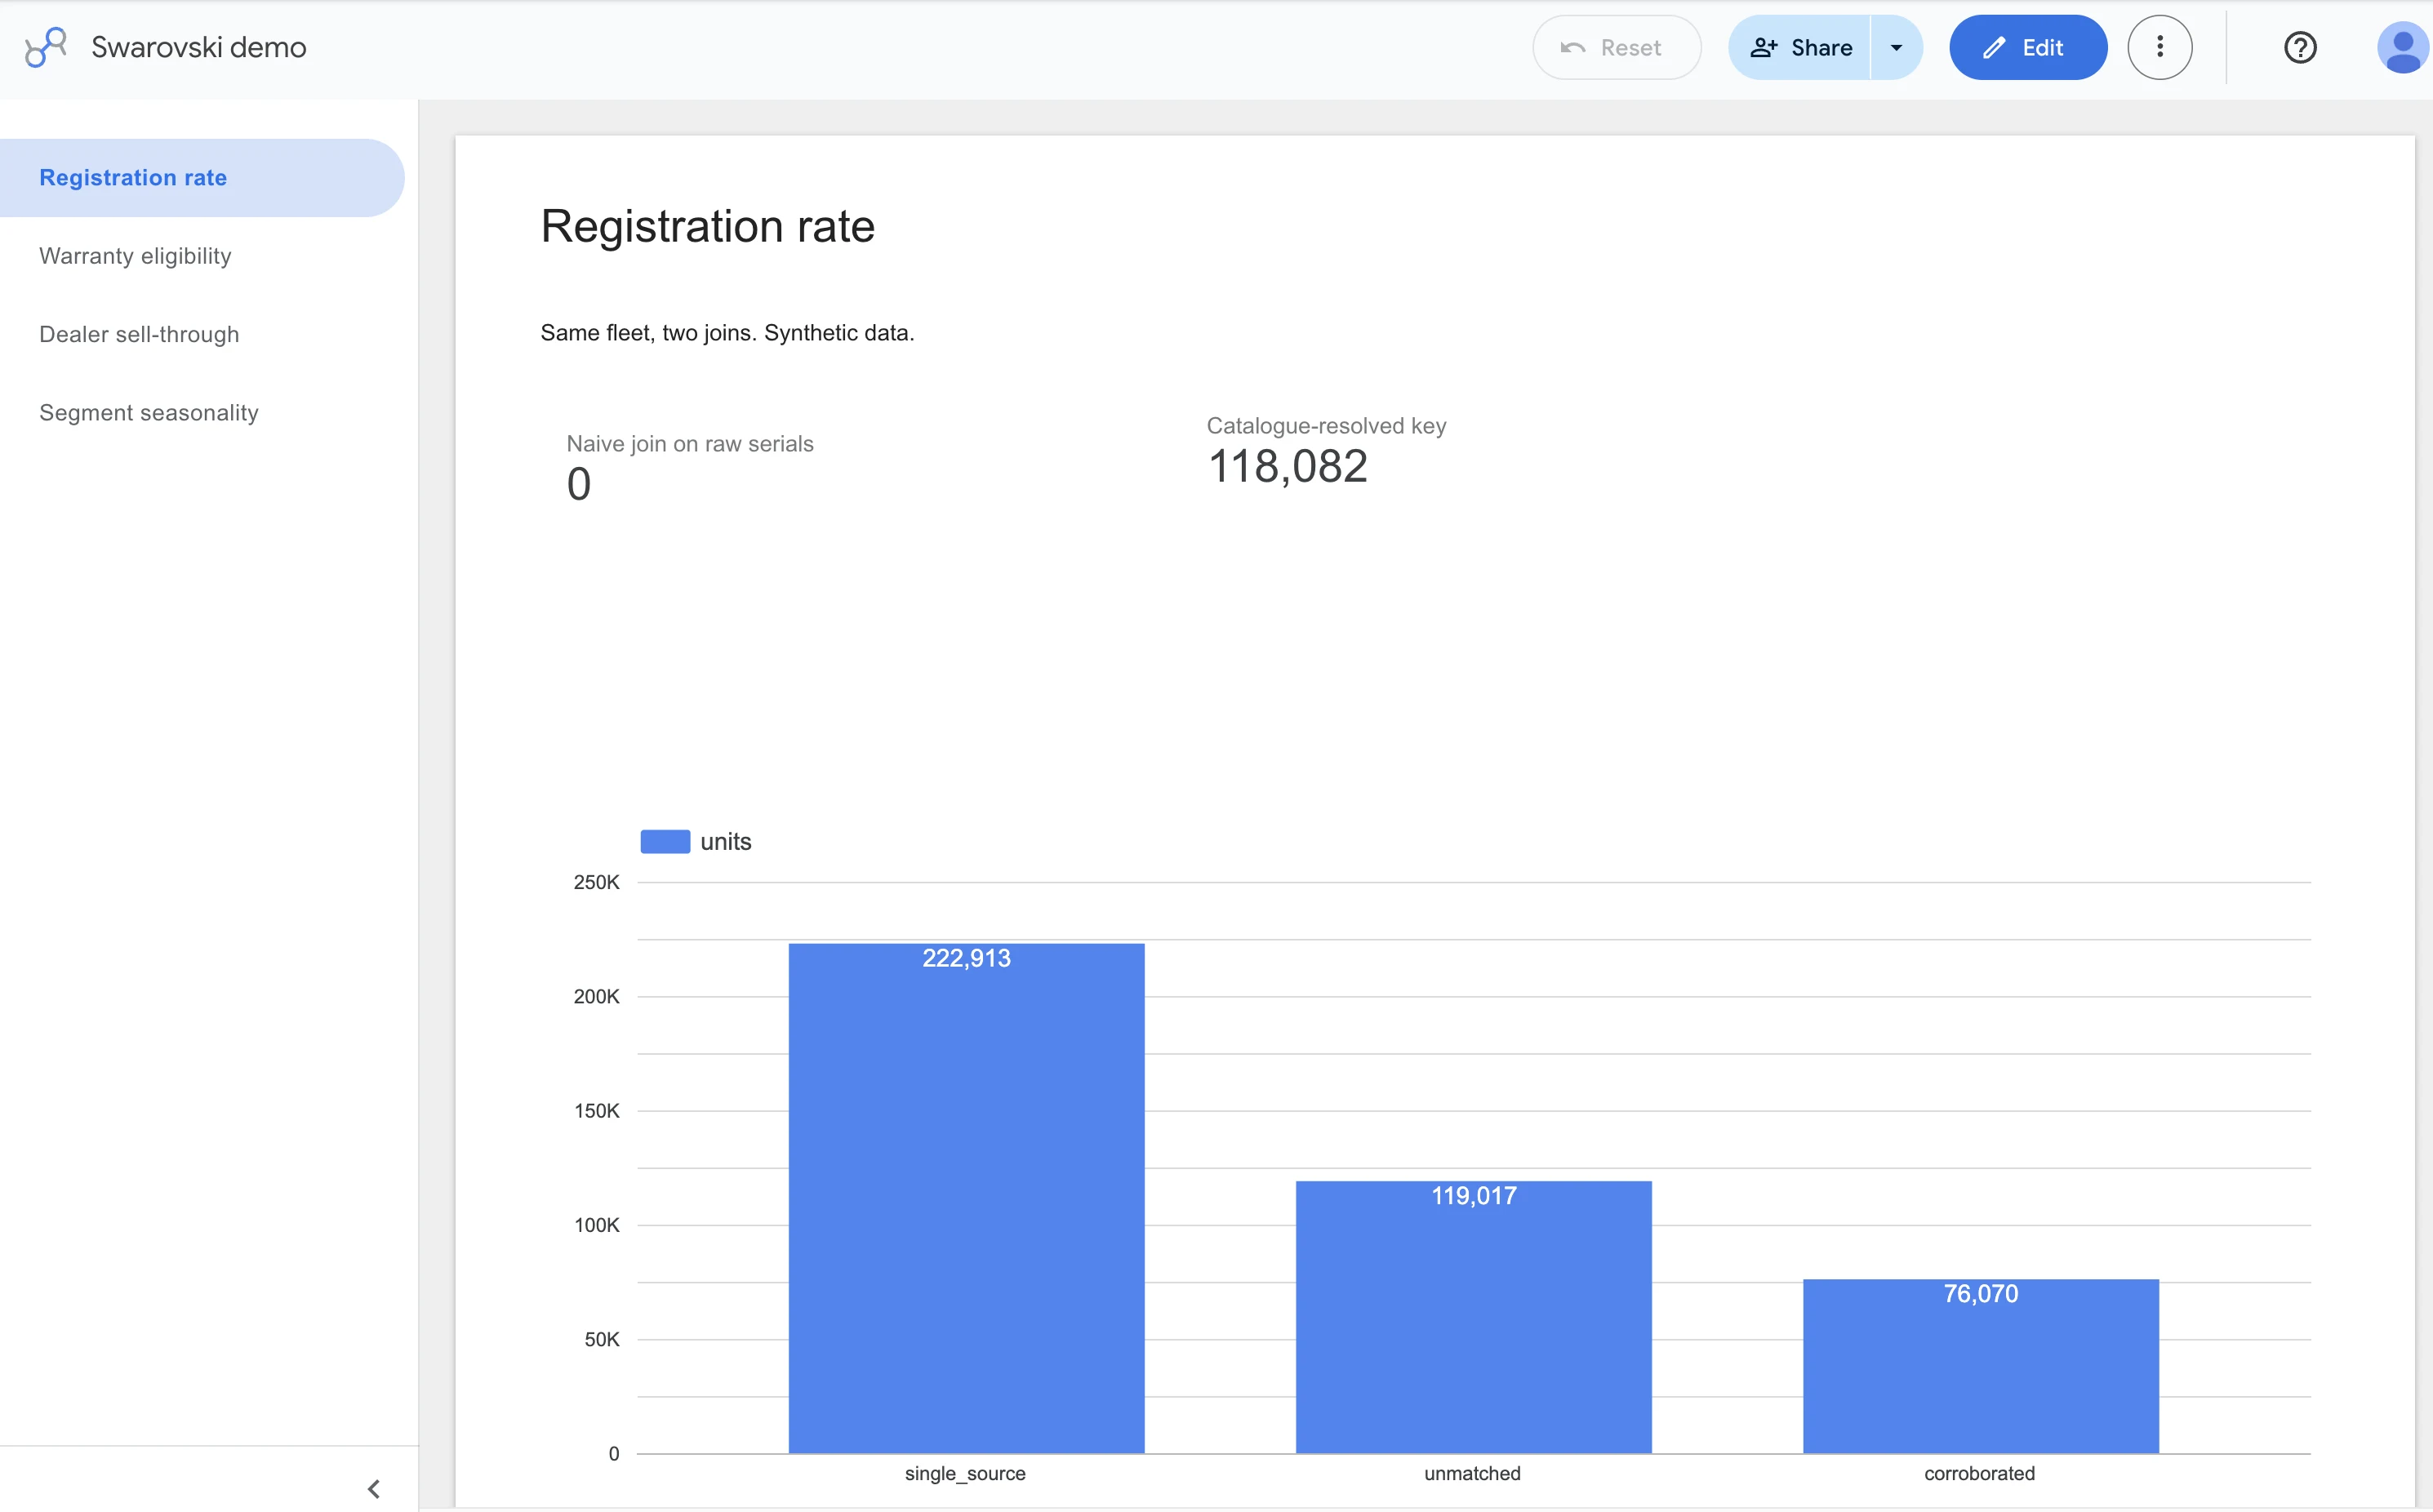
Once a unit leaves the factory, the dealer, the owner, and the service desk each retype that same serial number, and none of them types it the same way. Join on the raw string as each system wrote it, and you match zero units. Nothing. Run it through the catalogue resolved version instead, and it is one hundred and eighteen thousand and eighty two matches, twenty eight point two percent of units registered, plus two thousand five hundred and twenty one duplicate registrations caught along the way. All of it synthetic data, built to make the pattern visible.
Here's the trap that caught my own first attempt. My instinct was to split the model code from the serial with a regular expression. That fails, and fails silently, because model codes themselves contain digits, so once you strip the separators there's no boundary left to find. Take a serial like S W N L zero eight four two zero one zero zero one zero zero. A greedy match slices it in the wrong place and joins to nothing. The only way to find the real boundary is to look it up.
So the fix is five steps. Normalize: strip everything down to letters and digits, uppercase, so a stray space or lowercase letter doesn't matter. Look up the longest matching model code against the actual product catalogue, something like E L forty two ten. Split there, letting the catalogue decide where the model ends and the serial tail begins, never a pattern guessing at it. Clean the remainder: strip leading zeros, correct the classic transcription slips, an O standing in for a zero, an I for a one. Rebuild one standard form every downstream system can agree on.
Every resolved serial then carries a confidence tier, not a flat yes or no. Exact means a downstream system already wrote the standard form itself. Corrected means it needed padding or one character fixed. Partial means it's flagged, and a flagged serial never feeds into a financial number.
There's a folded section underneath on why the data looks like this. No conspiracy, just accidents: the engraved characters are small, printing is inconsistent across product lines, nothing validates a serial as it's typed, older units predate the current format, and dealers sometimes register on a customer's behalf from records already reformatted once. Some things resolution genuinely cannot recover: transposed digits, a serial from a different product entirely, a box barcode typed in instead of the serial itself. Those get flagged, not guessed, because a confident wrong join is worse than a gap.
Two ways to stop it recurring. Validate at entry: check the serial against the catalogue the moment it's typed, capture it by camera in the existing mobile app, and confirm the model back to the user. And for connected products that already pair over Bluetooth, let the device assert its own serial, so nobody types anything at all.
Next, the section called in the field: the return, the warranty clock and the dealer's shelf.
The reworked unit comes back at two point four six times the rate of one that passed first time, and whether that counts as a warranty case depends on a timestamp nobody agreed on.
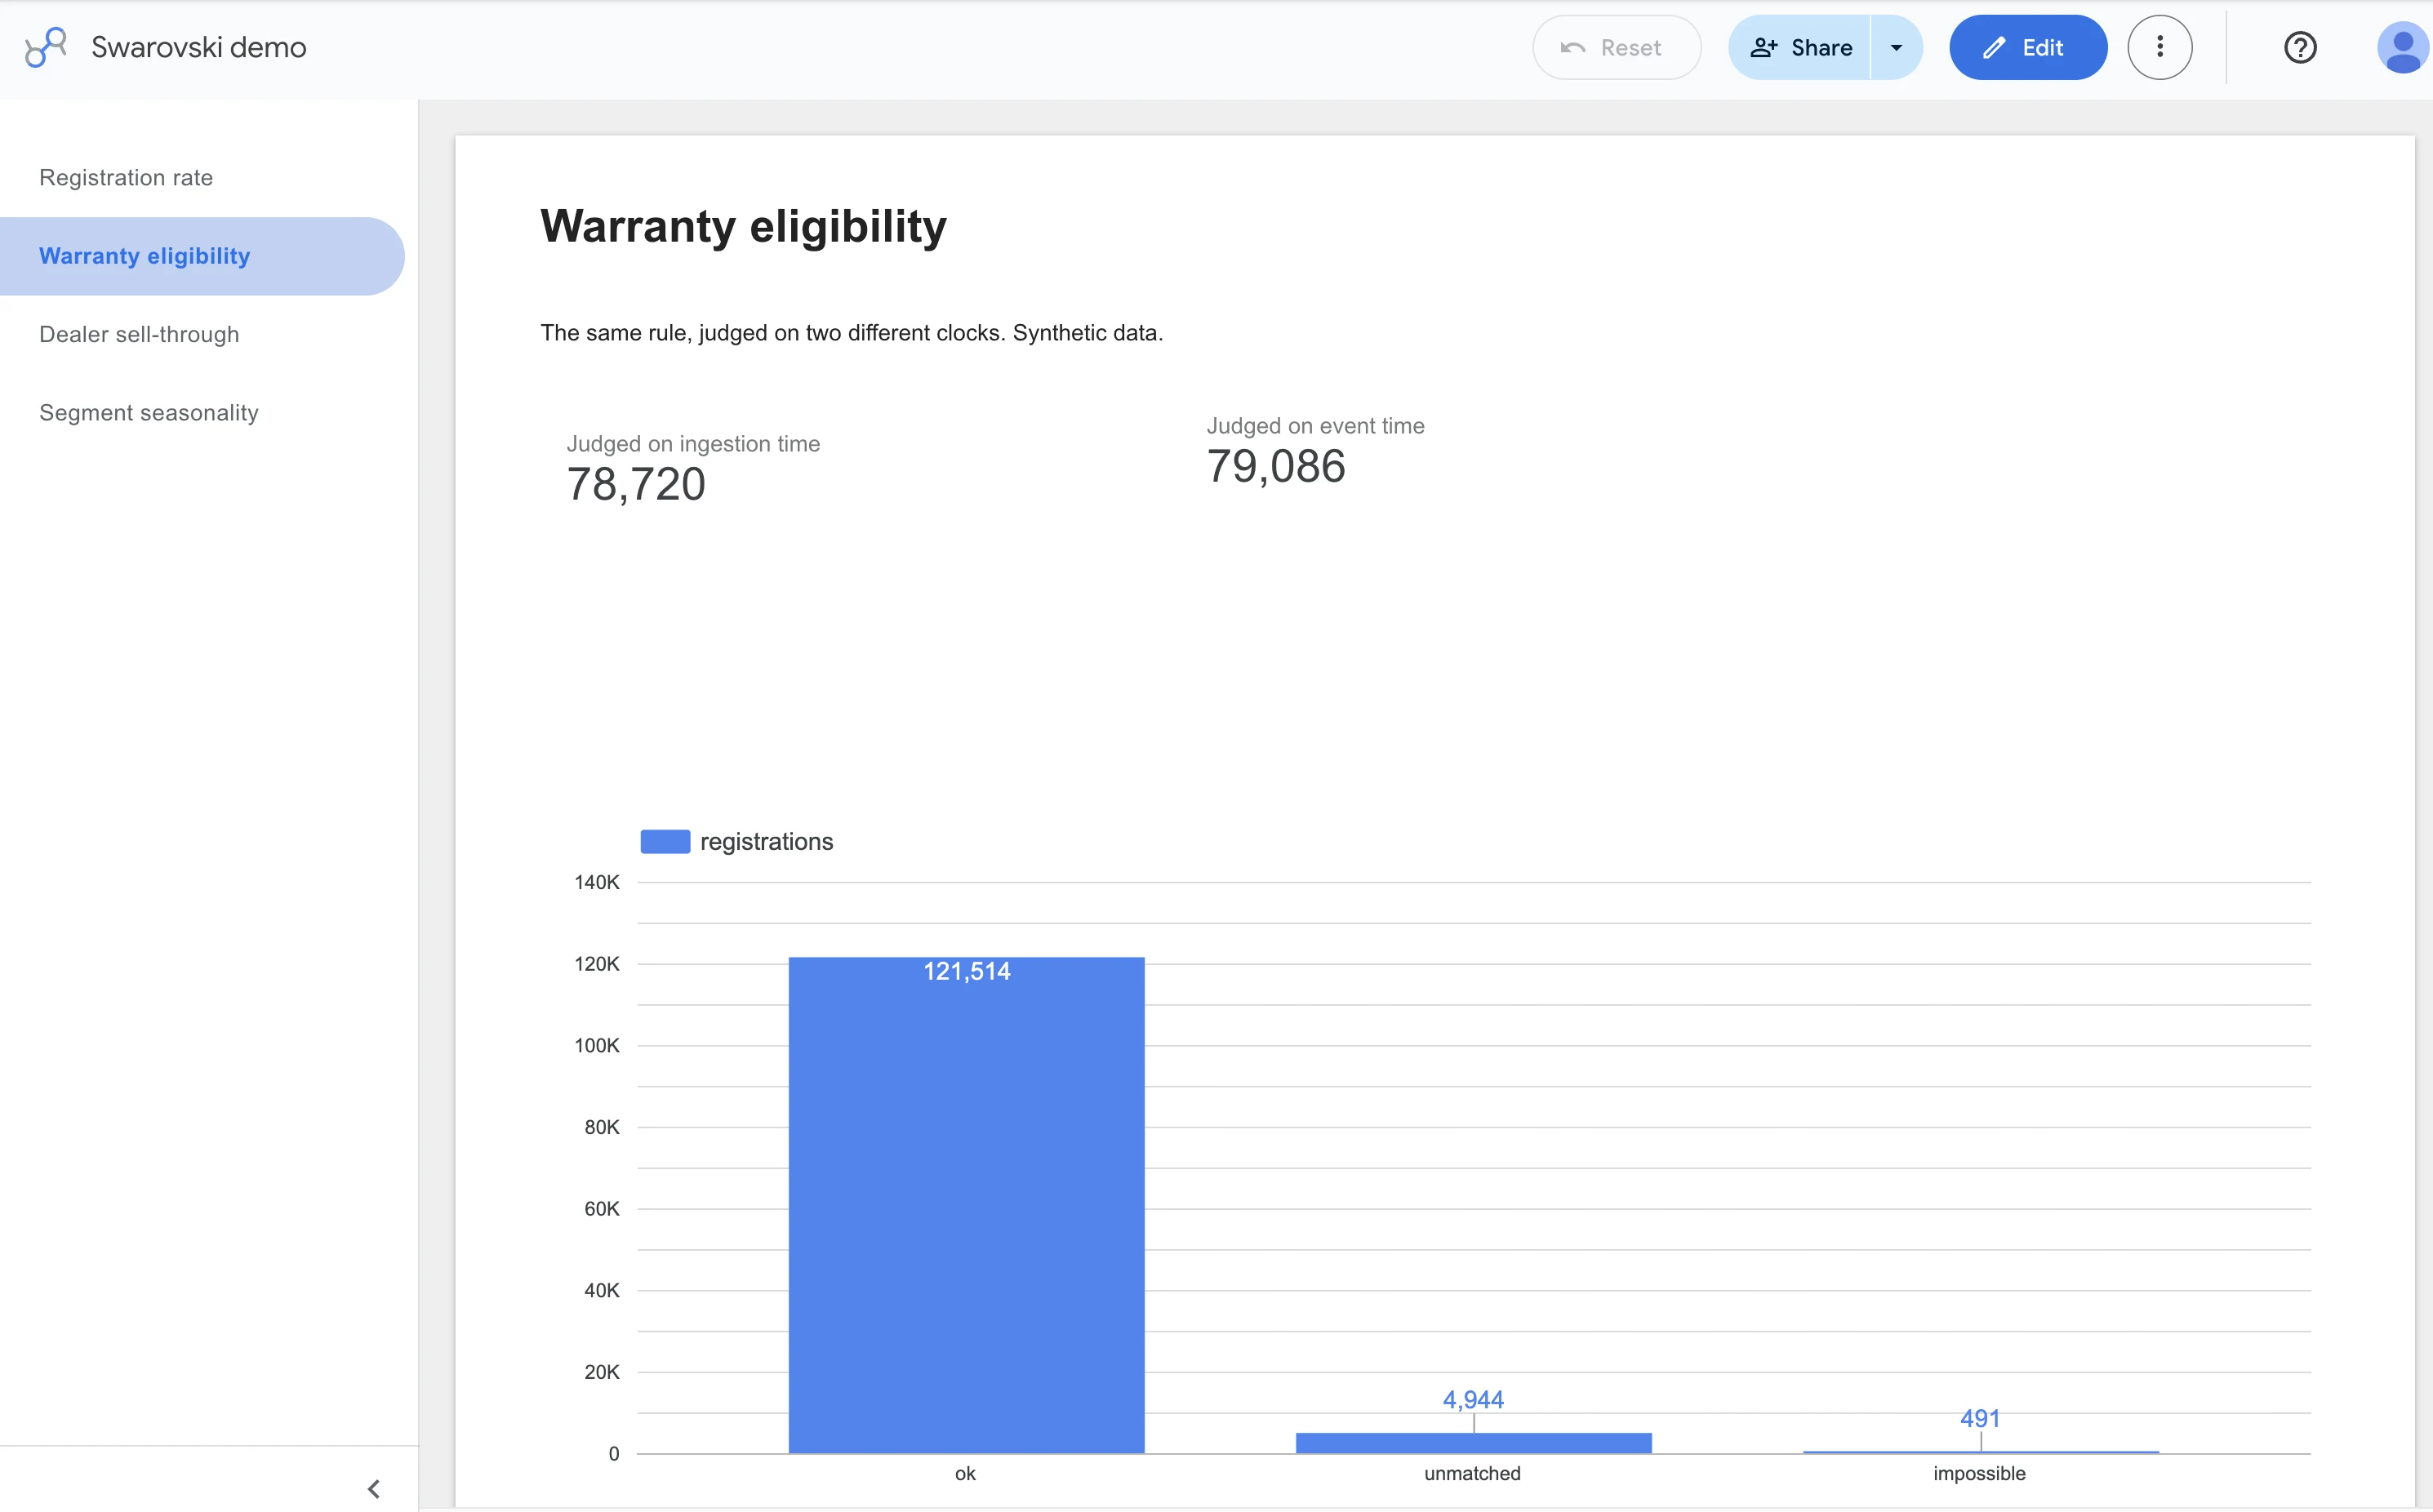
This section covers three more places downstream where a hidden data problem changes what a number means. First, the warranty clock. Warranty eligibility is judged on when the system heard about a registration, not when the owner acted. I modelled this because registration timestamps carry no time zone at all. Seventy eight thousand, seven hundred and twenty units are eligible on our clock, seventy nine thousand and eighty six on theirs. One hundred and ninety nine decisions flip on time zone alone, and three hundred and sixty six units would be wrongly refused a claim they are actually entitled to.
Second, the dealer's shelf. A dealer changed their file format overnight. Nothing errored. A parser built for the old format silently dropped whatever it could no longer read. Of two hundred forty thousand, nine hundred and fifty six sell through rows, only one hundred seventy two thousand, three hundred and ten survive that silent drop, and sixty eight thousand, six hundred and forty six rows land in the wrong month.
Third, seasonality. Hunting spikes for the season opener. Birding never spikes. Averaging hides both. Blend the two segments together and the peak reads as one point five two times average demand. Split them apart and the hunting segment's real peak is two point five five times average. Averaging the two together does not soften the picture, it hides it.
All of these figures are synthetic, and the dashboard page behind each one still exists, one click away in the underlying report.
Next, the section called the people around it: the owner nobody can reach and the lead counted twice.
This whole page has followed one serial number through the factory. This section asks the same question about people. If this unit gets recalled, can you reach the owner? And on the marketing side, when someone converts, does the system know that's the same person twice, or does it quietly double them? The same identity gap that scrambles a serial number scrambles an email address in the C R M just as easily.
Here's the concrete number. Count rows the way both dashboards do it today, every web form submission plus every C R M lead row added together, and you get two hundred nine thousand and forty seven leads. That is not two hundred nine thousand people. Resolve every row down to one key per actual human, and the number drops to seventy seven thousand, six hundred and fifty one. All synthetic figures, built for this exercise, but the same disease as the serial, just on an email address instead of a serial number.
Underneath that number is a short, ordered set of rules, with a tier written onto every row forever. Lowercase and trim the address, that alone fixes most of it. Collapse a provider's alias trick, only where the rule is documented. Do not repair a typo. A domain one character off gets flagged, not silently guessed at. Of those two hundred nine thousand rows, one hundred thirty six thousand, eight hundred fifty six matched exactly, seventy thousand, five hundred nineteen needed normalizing, and one thousand, six hundred seventy two stayed flagged rather than get force merged into someone else's identity.
Campaign names carry the same disease. Three hundred eighty real campaigns show up on the web as three thousand and forty six distinct spellings. Join the cost report on that raw string, the way it's joined today, and search advertising looks like it costs nine hundred sixty six euros a lead. Resolve the names first, and it's fifty six euros. The spend never moved, the join did. Email shows the widest gap, two thousand and sixty nine euros raw against fifty seven point nine resolved, and the same shape repeats across social, dealer events, and print and Q R codes.
One mistake I made building this is worth saying out loud, because it's the honest version of this whole page. My generator built those campaign names by combining a subsidiary, a theme, and sometimes a model, picked at random, and only two hundred fifty five of the three hundred eighty came out distinct. The campaign view joins on the normalized name, so a session landing on a name two campaigns happened to share silently fanned into two rows and doubled that campaign's numbers in the cost table.
Nothing threw an error. I caught it by counting distinct names before trusting the join. The fix was a suffix on the repeats and a test that now fails the moment two names collide again.
Next, two sections: what done means for this one problem, and where I would start, and why.
I said the real question, why a unit failed and what it cost, only gets answered once a pipeline can prove six things about itself. First, it runs on a schedule and checks its own output, refusing to report success against an empty table or a number that didn't move the way it should. Second, the number on the dashboard is the number in the query, and that query has an owner, version controlled. Third, every row carries where it came from, who or what captured it, and how confident the fix is, so the dashboard can show you the share that's guessed, which is zero, and the share that's flagged, which is not.
Fourth, what can't be recovered is written down beside the number, because a stated limit is a decision and a hidden one is a future incident. Fifth, it's safe to run twice, so a retry at three in the morning can't double anything. Sixth, the mistakes get logged, with what actually caught each one.
Done is a state the pipeline can prove, not a status somebody sets. The same test covers a move to a new cloud setup: it is done when the old system is empty and the new one passes the same six checks.
Then I ranked everything on this page by value to production and sales against the effort to build it. The top four are all high value, and none of them is a dashboard. Put a capture method column on every record. Build the quality control reason catalogue. Resolve the serial key across the systems that spell it differently. And make the event loads idempotent and partitioned. The first two are low effort: capture method just needs one column the loader can populate, and the reason catalogue needs coded reasons, not a new system, since that dashboard already exists.
Below those, lead identity resolution and a campaign name registry are medium value and low effort, and that registry alone collapses three thousand and forty six campaign spellings down to the real three hundred and eighty. Reconciling the two E R P systems is high value but high effort, since it needs that key work done first and an owner for the conflicts that follow. Warranty timing on the customer's clock and late data watermarks are medium value, medium and low effort. That pattern, keys and columns before dashboards, is where the easy wins sit in most warehouses I've seen, including my own.
Next, the section on where automated tools fit, and where they do not.
Every messy input on this page is something today's models read well, and four examples show it. A free text failure note, in any language, becomes a proposed reason code with a confidence score, and once an inspector approves it, it becomes a rule. A photo of a receipt becomes a proposed purchase date, entered as a claim with its own confidence score, not as fact. The app's camera reads an engraved serial and checks it against the same catalogue used to resolve serials on this page. And for an odd dealer file, a model proposes the mapping, a person approves it once, and it becomes a rule too.
In every case, I treat that output as one more source with a confidence score. It never writes a financial number, and it never writes a quality verdict, on its own.
That is the same rule I use through the rest of this page. Resolve what you can, flag what you cannot, never guess. The models are already good enough for all four of these jobs. The question is no longer whether it can read the input. It is what it is allowed to touch, and that is a governance question.
Next, the section on four flows, one shape, and every one checks its own work, where I show you how this whole page actually runs.
Underneath it are four separate pipelines: product, people, the production scale event stream, and quality control. I built all four the same shape on purpose. Each one generates its own synthetic data, loads it into the warehouse in parallel, builds views on top, then runs a verify step that queries what it just built and refuses to report success if a table comes back empty, or if the headline number didn't move the way it's supposed to. A pipeline that says done without checking anything is the exact failure this whole page argues against.
The proof is screenshots of those runs actually finishing. The product slice: eleven tasks, four loads in parallel, landing as four tables and eight views. The people slice: five loads in parallel, same verify step. The production scale slice is the big one: eighteen tasks, most of it one long load of eight point five million station events across nine chunks, the merge running twice on purpose with the second run inserting nothing, fourteen minutes end to end.
The quality control slice: fourteen tasks, five loads in parallel, six views, landing as five tables holding component inspections at lot grain, unit inspections at serial grain, the reason catalogue, and the lot to serial genealogy table. Its verify step also checks that the naive serial join matches fewer rows than the resolved one before it calls the run good, ninety seconds end to end. I pulled the raw rows too: final inspection fails from the unit inspection table, hand written columns visible, the free text reason, the operator's initials, logged time against actual time.
The stack behind it: Python for the pipeline's own code, Prefect as the workflow scheduler that runs it, BigQuery as the cloud data warehouse with partitioned and clustered tables, views kept in version control, Terraform for everything around it, and Looker Studio as the dashboard layer on top. Synthetic data throughout.
Next, the section on sixteen more consequences of the same problem, sketched.
These sixteen aren't built out the way the earlier sections are. Each one is just the trap and the shape of the fix, using the same synthetic data.
Ten sit on the marketing and C R M side. One example: eighty point six percent of won deals close after their campaign has already ended, so judging the campaign at its end date makes a win look like a loss. Other sketches in that group cover a lead that goes silent after being handed to a dealer, consent that needs its own timestamp, bot traffic that gets rejected and kept rather than deleted, and a form field that quietly drops out and takes a lead score with it.
The other six sit on the product side, on the same serial and registration tables. Duplicate registrations that are really families, not errors, two thousand five hundred and twenty one units of them. A unit crossing a border between the dealer, the registration and the service desk. A returned unit that gets resold and counted twice. And a recall trace, where seventy one point eight percent of owners have no contact path at all.
Same rule as everywhere else on this page: resolve what you can, flag what you can't, never guess.
That's the page: one failed binocular, followed all the way through six systems, with the mistakes and the limits written down next to the numbers instead of hidden underneath them.

The problem, in pieces
These are problems a precision-optics manufacturer described to me: symptoms of one underlying failure, seen from six different desks. I built a synthetic dataset shaped to match them and followed the failure through it.
| The symptom | What it is | Where it is answered |
|---|---|---|
| Nobody can say why products fail quality control | Failure reasons captured three ways, some by hand, none coded | 01 |
| Production needs two systems to answer one question | The ERP and the CRM disagree on the key that should join them | 03 |
| Production data is a real issue right now | Two ERP generations, a firehose of station events, late arrivals, replays, a renamed column | 02 |
| How much is done by hand versus by a system | A capture-method column on every record, then it is a number | 01, done |
| Highest value, lowest effort first | A ranked table of the scenarios on this page | Priorities |
| Formalising what done means | A definition of done the pipeline enforces on itself | done |
I have used generic names on purpose. The ERP, the CRM, the legacy system. The engineering is the same whichever vendors sit behind them. These are not six separate problems. They are one failure, seen from six different desks.
One dataset, one thread
Eleven synthetic tables, and one serial number that is supposed to thread a product from the work order to the field. Where there is no serial, an email address threads a person from the web to the CRM. Nothing enforces either thread, so every system holds its own spelling.
| Slice | System | Rows | The key, as that system writes it |
|---|---|---|---|
| Production | Work orders, two ERP generations | 58,071 | 0000123456 · WO-123456 |
| Production | Station and machine events | 8,500,000 | serial on 60% of rows |
| Production | Quality control inspections | 683,292 | SW-EL4210-0000123 |
| Product | Manufacturing | 418,000 | SW-EL4210-0000123 |
| Product | Dealer sell-through | 240,956 | EL4210-123 |
| Product | Customer registration | 126,949 | sw el4210 0000123 |
| Product | Service history | 20,490 | SWEL42100000123 |
| People | Web sessions | 600,000 | Spring_Hunting_2026_v2 |
| People | Form submissions | 114,047 | Anna.Huber@example.com |
| People | CRM leads | 95,000 | ANNA.HUBER@EXAMPLE.COM |
| People | Opportunities | 18,000 | lead_id only |
Baked in on purpose: stripped zeros, typos, duplicate registrations, timestamps with no timezone, dealers who report late or never, one file format that changed overnight, failure reasons written in three languages, re-sent event batches, a column that was renamed mid-year, and 516 registrations dated before their unit was built.
The spine of the page
The unit
One real row from the synthetic data, followed through every table it touches. Serial SW-EL3210-0297707, a binocular for the birding segment, list price 2,890 euro.
Its lens lot, LOT-LNS-EL3210-00254, is recorded three times at lot grain in the component-inspection table, by the grinding machine, the interferometer and the coating line, all three passes, all three written by a system. Its housing lot, LOT-HSG-EL3210-00254, is recorded three times too: machining and anodizing by the machines, hand finishing by a person. Neither lot knows the serial yet, because the serial does not exist until clean-room assembly on 6 February 2021, when the two lots become one unit under work order WO000991 and the serial is written for the first time, by hand, into the unit-inspection log and the lot-to-serial genealogy table.
The same afternoon it fails final inspection. The inspector types scrach, no code, and logs the row an hour and a half after the inspection time. It goes back to assembly, passes, fails final inspection again on 9 February with focuss drift, goes back once more, is flagged at assembly for glue residue, and passes final inspection on the third attempt on 10 February. Six hand-written rows, five different operator initials, three free-text reasons that no catalogue matches as typed, and a station clock set to New York time on a unit built at a European plant.
From there the ERP has it sold by a dealer in Germany on 22 October 2021, reported seven days later as EL3210-297707. The owner registers it on the web a month later, from a Canadian subsidiary, as sw el3210 0297707. The service desk in Canada logs a warranty repair in April 2022 and a paid cleaning in December 2024, both under SWEL32100297707. Four systems, four spellings of one serial, a unit that crossed a border, and a warranty case on a unit that was reworked twice before it left. Every section below is one more place that gap shows up.
Downstream 01
At the station: why it failed
SW-EL3210-0297707 failed here, at final inspection, and the quality-control log is the only system that knows why.
Because nobody can group the reasons. The same failure is written as a code, as English and as German, and nine in ten rows were typed by hand.
All four figures are synthetic.
One failure, written three ways
The machine stations write a code. The hand stations write what the inspector saw, in whichever language came first: Staub, dust, Fingerabdruck, fingerprint, Zentrierung, collimation off, with capitals and spaces varying by shift. Group by the raw string and the top failure reason is split into a dozen small ones, and the dashboard says "other".
CLA-DUST                     coded, from the machine
Staub · dust · STAUB          mapped to CLA-DUST, two languages
Kleber                       mapped to CLA-GLUE
                             empty on a fail, flagged
staubig, leicht              no catalogue match, flagged
Four steps
- A reason catalogue. One code per known cause, per station, each with its English and German phrasings.48 phrasings, 32 codes
- Map, do not guess. A phrase that matches becomes a code. One that does not stays flagged.4,593 of 27,279 fails flagged
- Remove the double entries. The same serial, station and minute logged twice by hand is one failure.12,466 duplicates removed
- Carry the capture method. Every inspection says whether a person or a system wrote it down.hand · system
How much is done by hand
This is a question nobody could answer directly. With a capture-method column it is a table, per station. The machine stations record one row per lot of lenses or housings; the hand stations record one row per unit, which is why nine in ten rows are hand-written even though five of the eight stations are automated. The same column shows where the record is unusable: empty reasons, duplicates and unmatched phrases appear only where a person wrote the row.
| Station, in process order | Captured by | Rows | Fail rate | Empty reason | Duplicates | Unmatched |
|---|---|---|---|---|---|---|
| Glass grinding and polishing | system | 10,157 | 2.1% | 0 | 0 | 0 |
| Lens interferometer check | system | 10,157 | 3.5% | 0 | 0 | 0 |
| Lens coating | system | 10,157 | 1.5% | 0 | 0 | 0 |
| Housing machining | system | 10,157 | 0.8% | 0 | 0 | 0 |
| Housing hand finishing | hand | 10,367 | 2.3% | 3.8% | 2.0% | 17.3% |
| Anodizing | system | 10,157 | 1.3% | 0 | 0 | 0 |
| Clean-room assembly | hand | 311,156 | 4.5% | 3.6% | 2.0% | 18.1% |
| Final inspection | hand | 310,984 | 3.9% | 3.4% | 1.9% | 16.7% |
Synthetic figures.
The link to the field, which needs downstream 03
A unit that failed final inspection, went back to assembly and passed on the second or third attempt turns up in service later at 2.46 times the rate of a unit that passed first time: 10.0% of 10,529 reworked units against 4.1% of 282,229. That join runs from the inspection log to the service history on the serial number, which is exactly the key downstream 03 has to repair first. The lens and housing lots behind each serial are in a genealogy table, so a field return can be traced to the lot it came from. Without the serial join, all of this is zero.
What resolution cannot recover
- A fail with no reason at all. It is counted as a fail and flagged, never assigned a cause.
- A reason phrased in a way the catalogue has never seen.
- Which of two hand-logged duplicates carried the correct time.
The mistake I made
Three in this slice, none of which raised an error. The join that checks a hand-typed serial against the manufacturing table forgot to strip the brand prefix before matching, so the "correct" side of the check matched zero rows and the naive side looked better than it. A count of matches per side found it. The catalogue that maps phrases to codes listed several spellings that collapse to the same key after lower-casing, so the join fanned each hand-written row out into several, and every hand station's row count was 3 to 4% too high while duplicates read 4% instead of 2%. A row count of the view against the sum of its tables found it. And the routine that imitates a typist writing the letter O for a zero could put an O where the digit had never been a zero, which no rule can reverse; 1.1% of serials were unrecoverable until it was restricted to real zeros. In every case the number that caught it was one I had already decided to check before trusting the join.
Prevention
Coded picklists at the station, free text as a note
The inspector picks the code and can still type what they saw. The code is what the dashboard groups on. The note is what the engineer reads.
A capture-method column on every record, everywhere
Manual or system, on inspections, on registrations, on dealer files. Then "how much is done by hand" is a query, not a meeting.
Downstream 02
Upstream: which lot, which order, and two ERPs that disagree
To blame a lot for that fail you need the work order behind it, and the work order lives in two systems that do not agree on what it is.
Six things, and none of them is the volume itself. Keys, late arrivals, replays, a renamed column, a load that is not safe to run twice, and a query that reads everything to count one day.
All four figures are synthetic, measured on the loaded dataset.
Two ERP generations, one order
The old system writes a work order as 0000123456 with an item number that has leading zeros and dates as YYYYMMDD strings, and sends a full dump every month. The new one writes WO-123456 as a change feed of inserts, updates and deletes. The same order, two keys, two shapes.
| Join | Legacy orders matched | Unmatched |
|---|---|---|
| Exact match on the raw key | 0 | 53,571 |
| Strip the zeros, add the prefix, map the item number through a crosswalk | 25,500 | 28,071 |
The 28,071 that stay unmatched are orders closed before the new system existed, and the view keeps them as legacy-only rather than dropping them. Of the 25,500 orders both systems know, 2,464 disagree on quantity or status. The unified view carries a source-of-truth column with three values, legacy-only, new and conflict, so a conflict is shown rather than settled by picking a favourite.
The day is not over when the day is over
Of 8.2 million events, 12.9% were recorded on a later calendar day than they happened. On the worst day a count taken at midnight found 11,572 of the 13,411 events that eventually arrived, 15.8% short. Close the daily count at midnight and it is wrong; close it with a three-day watermark and it is right, three days later. The dashboard has to say which one it shows.
The load you can run twice
Events land in a staging table and are merged into the main table on their event id. The flow runs the merge twice on purpose and checks that the second run inserts nothing. The first run inserted 8,245,835 rows. The second inserted zero. That check is what makes a retry safe at three in the morning.
The column that changed its name
On 1 October 2025 the station software started writing its reading to a column called measure instead of value. The 3,816,582 rows before that day have only value; the 4,683,418 rows after it have only measure. The view reads whichever is present, and the row where both are empty is flagged rather than silently zero.
Counting one day without reading the year
| Same question, three ways | Data scanned |
|---|---|
| Count one day by turning the timestamp into a date | 178.5 MB |
| Count one day by the partition column | 0.11 MB |
| Count one day on one line, partition plus cluster | 0.22 MB |
The bill follows the second row. The warehouse charges a 10 MB minimum per query, so the billed gap is 17 times rather than 1,600, and the third row shows that a cluster filter also has to read the cluster column. Partitioning and clustering are decided when the table is created, which is why the load step matters more than the dashboard.
The mistake I made
Two, both caught before the load. The generator that writes the monthly legacy dump crashed on its second pass because I handed a date object to a function expecting a string; a one-line fix, but it would have shipped a half-written dump. The second is a definition, not a crash. The generator delays 5% of events on purpose, yet the late share measured 12.9%, because a calendar-day difference also counts a two-hour lag that crosses midnight as late. I left the number as measured and wrote the definition next to it, since the same thing will happen to any real dashboard that compares dates instead of timestamps.
Downstream 03
Out the door: the serial that four systems write four ways
The moment the unit leaves the factory, the same serial is re-typed by the dealer, the owner and the service desk, and none of them types it the same way.
The key that joins them has to be repaired first. Four systems write the same serial four ways, and a join on the raw string matches nothing.
Synthetic figures.
The trap that caught my first attempt
Split model from serial with a regex. It fails, and it fails silently, because model codes contain digits. Strip the separators and there is no boundary left to find.
SWNL08420100100

NL08420100100-0842010   greedy match, joins to nothing
NL0842-0100100          correct
Five steps
- Normalise. Letters and digits only, uppercase.sw el4210 0100171 → SWEL42100100171
- Look up. Longest matching model code from the product catalogue.EL4210
- Split there. The catalogue decides the boundary, not a pattern.EL4210 | 0100171
- Clean the remainder. Strip leading zeros, correct O for zero and I for one.O100171 → 0100171
- Rebuild. One standard form, every system agrees.EL4210-0100171
Then confidence, not a yes or no
- exact
- Certain. A downstream system wrote the exact standard form.
- corrected
- High. Needed padding or a character fixed.
- partial
- Flagged, never fed into a financial number.
Why the data is messy, what resolution cannot recover, and how to stop it recurring
No good reason, only accidents: small engraved characters invite transcription errors, printing is inconsistent across product lines, nothing validates the serial at entry, older units predate the current format, and dealers register on a customer's behalf from already-reformatted records.
What resolution cannot recover: transposed digits, a serial from a different product, the box barcode typed instead of the serial. These get flagged, not guessed. A confident wrong join is worse than a gap.
Tier one · validate at entry
Check the serial against the product catalogue as it is typed. Capture it by camera in the existing mobile app, and confirm the model back to the user. Entry errors drop close to zero.
Tier two · register automatically on first pair
Some product lines already pair over Bluetooth with a companion app. Let the device assert its own serial. Nobody types anything, so the serial is correct by construction.
Connected products only. Traditional binoculars and spotting scopes have no electronics, so camera capture stays the fallback.
Downstream 04
In the field: the return, the warranty clock and the dealer's shelf
The reworked unit comes back at 2.46 times the rate of one that passed first time, and whether that counts as a warranty case depends on a timestamp nobody agreed on.
A timestamp with financial consequences
Warranty eligibility is judged on when the system heard about a registration, not when the owner acted. 199 decisions flip on timezone alone.
78,720 eligible on our clock, 79,086 on theirs, 366 wrongly refused
Shipment is not a sale
A dealer changed their file format overnight. Nothing errored. A single-format parser silently dropped the rest.
172,310 kept of 240,956, 68,646 in the wrong month
Two demand shapes
Hunting spikes for the season opener. Birding never spikes. Averaging hides both.
a 2.55 peak read as 1.52
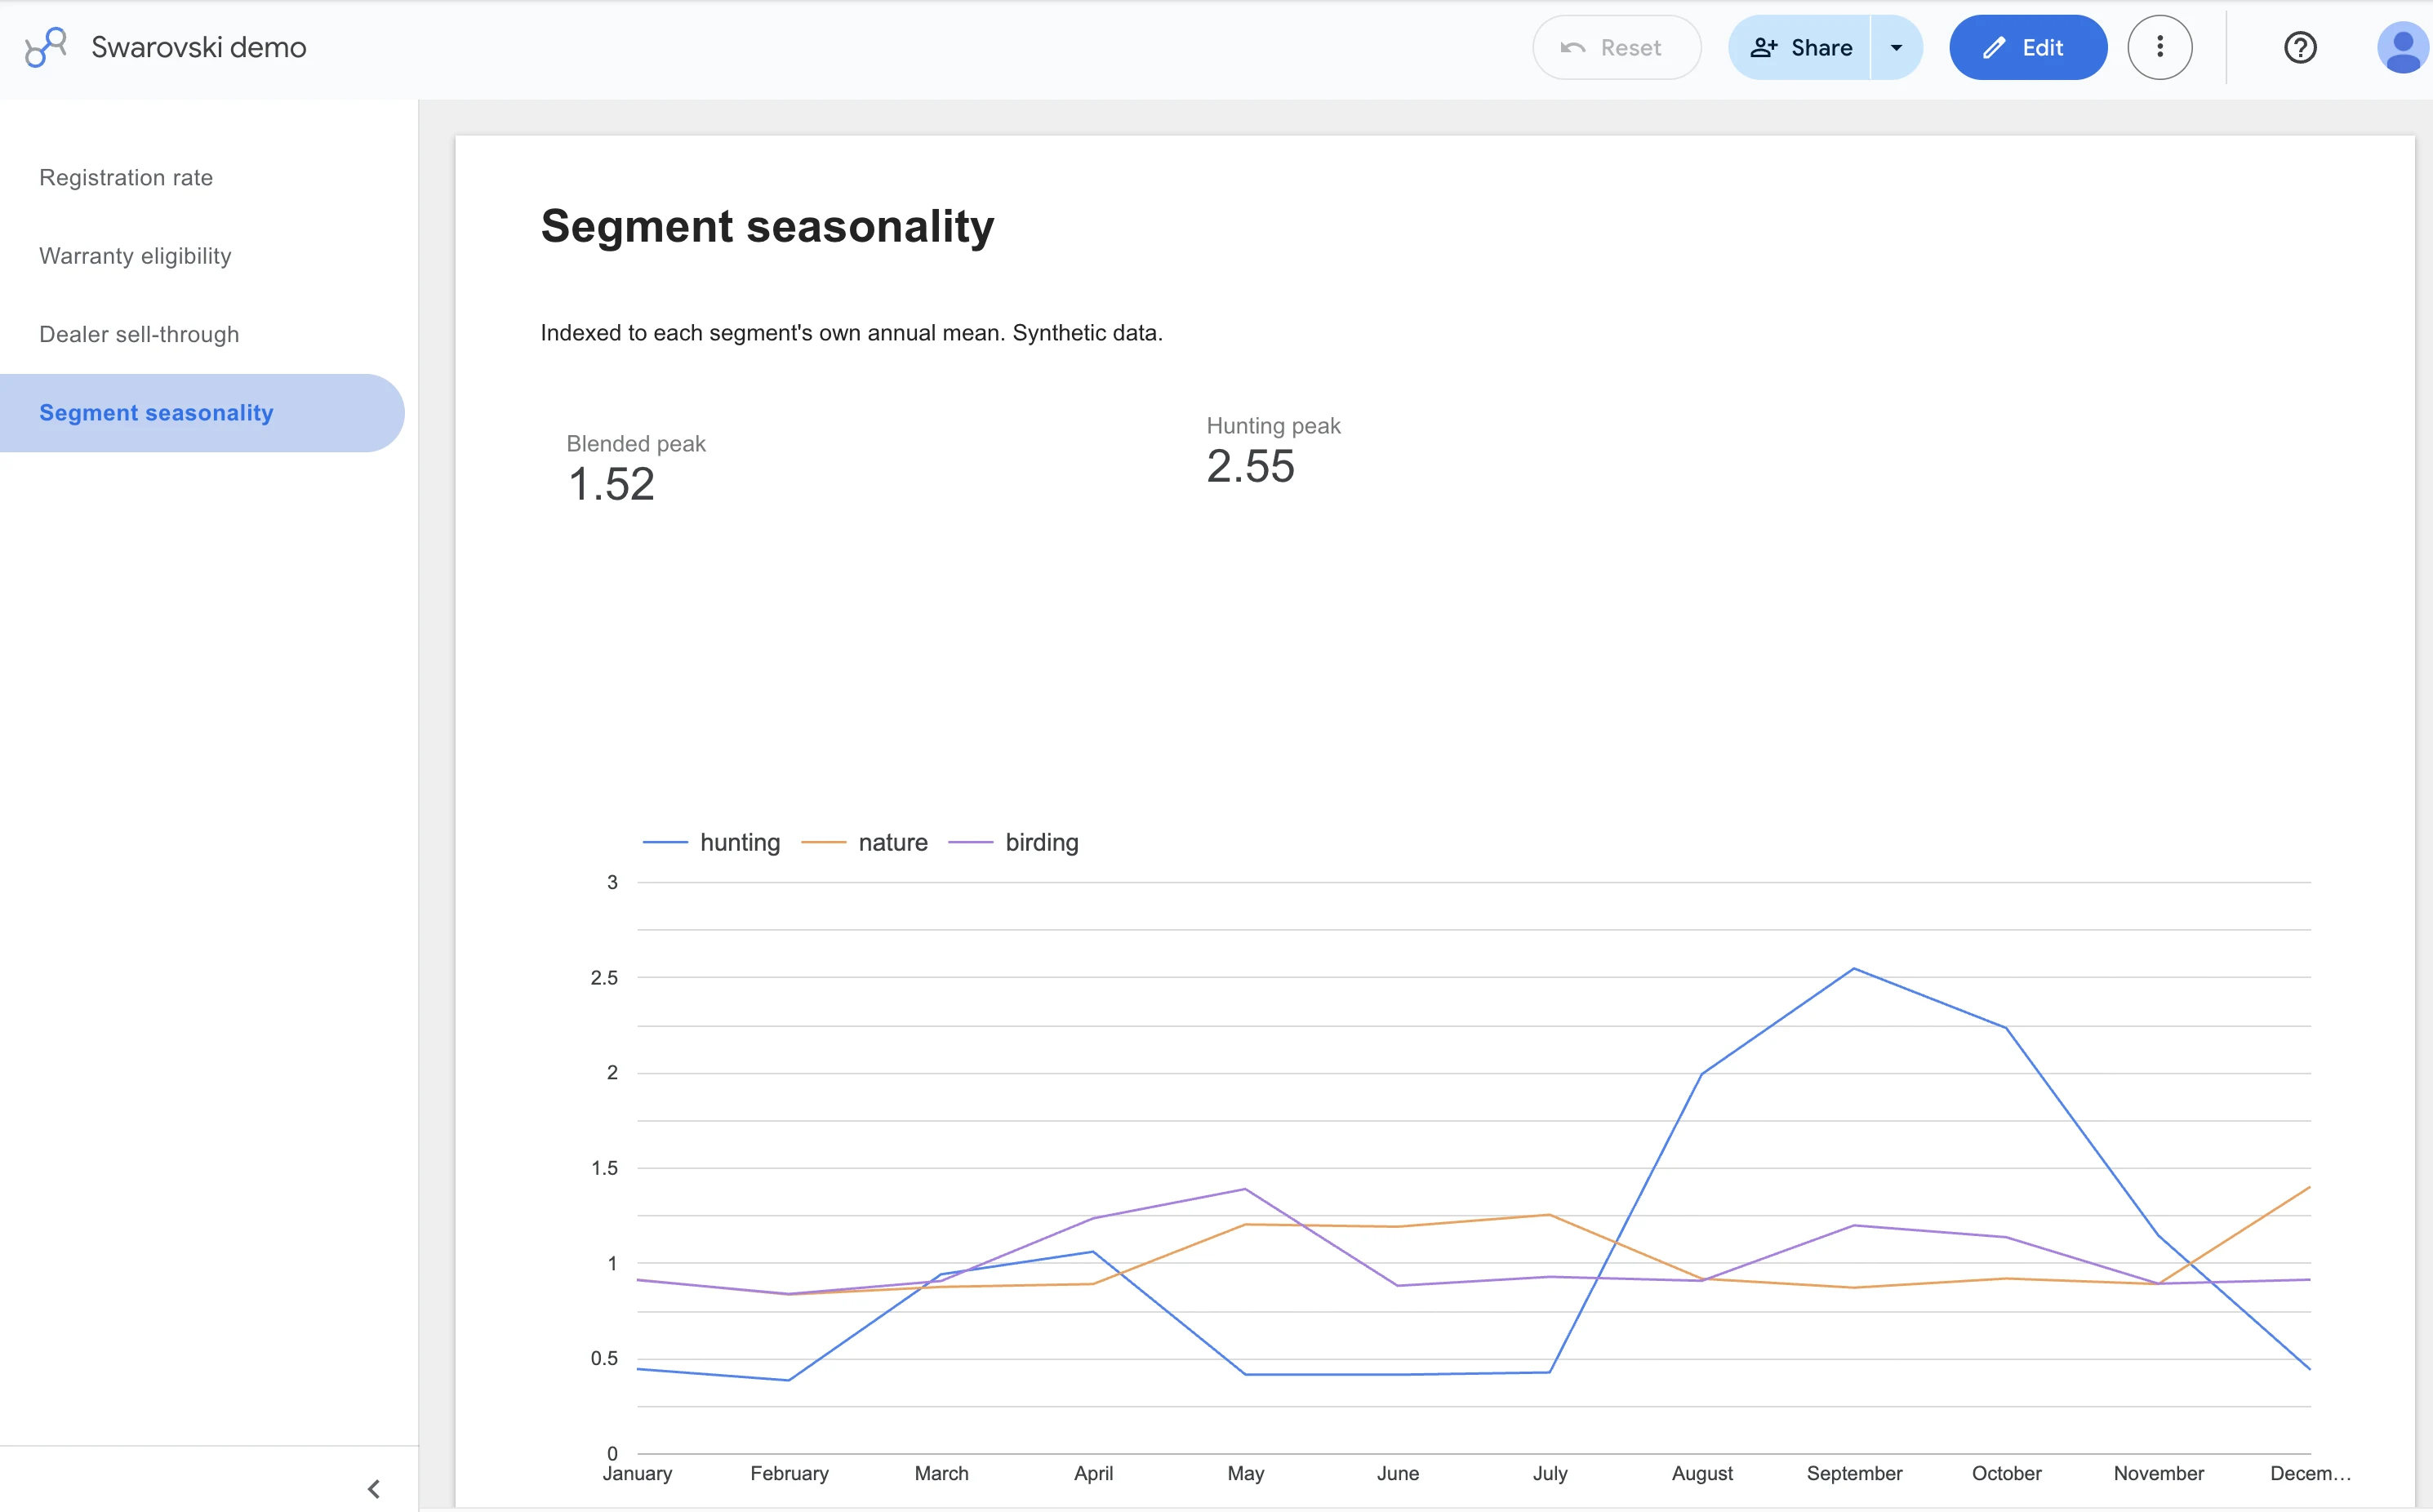
Synthetic figures. The dashboard pages for these three still exist and are one click away in the report.
Downstream 05
The people around it: the owner nobody can reach and the lead counted twice
The recall list for a unit like this one is only as good as the contact data behind it, and the same identity problem that scrambles a serial number scrambles an email address in the CRM.
The marketing dashboard says 209,047 leads. The number of people behind it is 77,651. Same pattern as the serials, applied to an email address.
Synthetic figures.
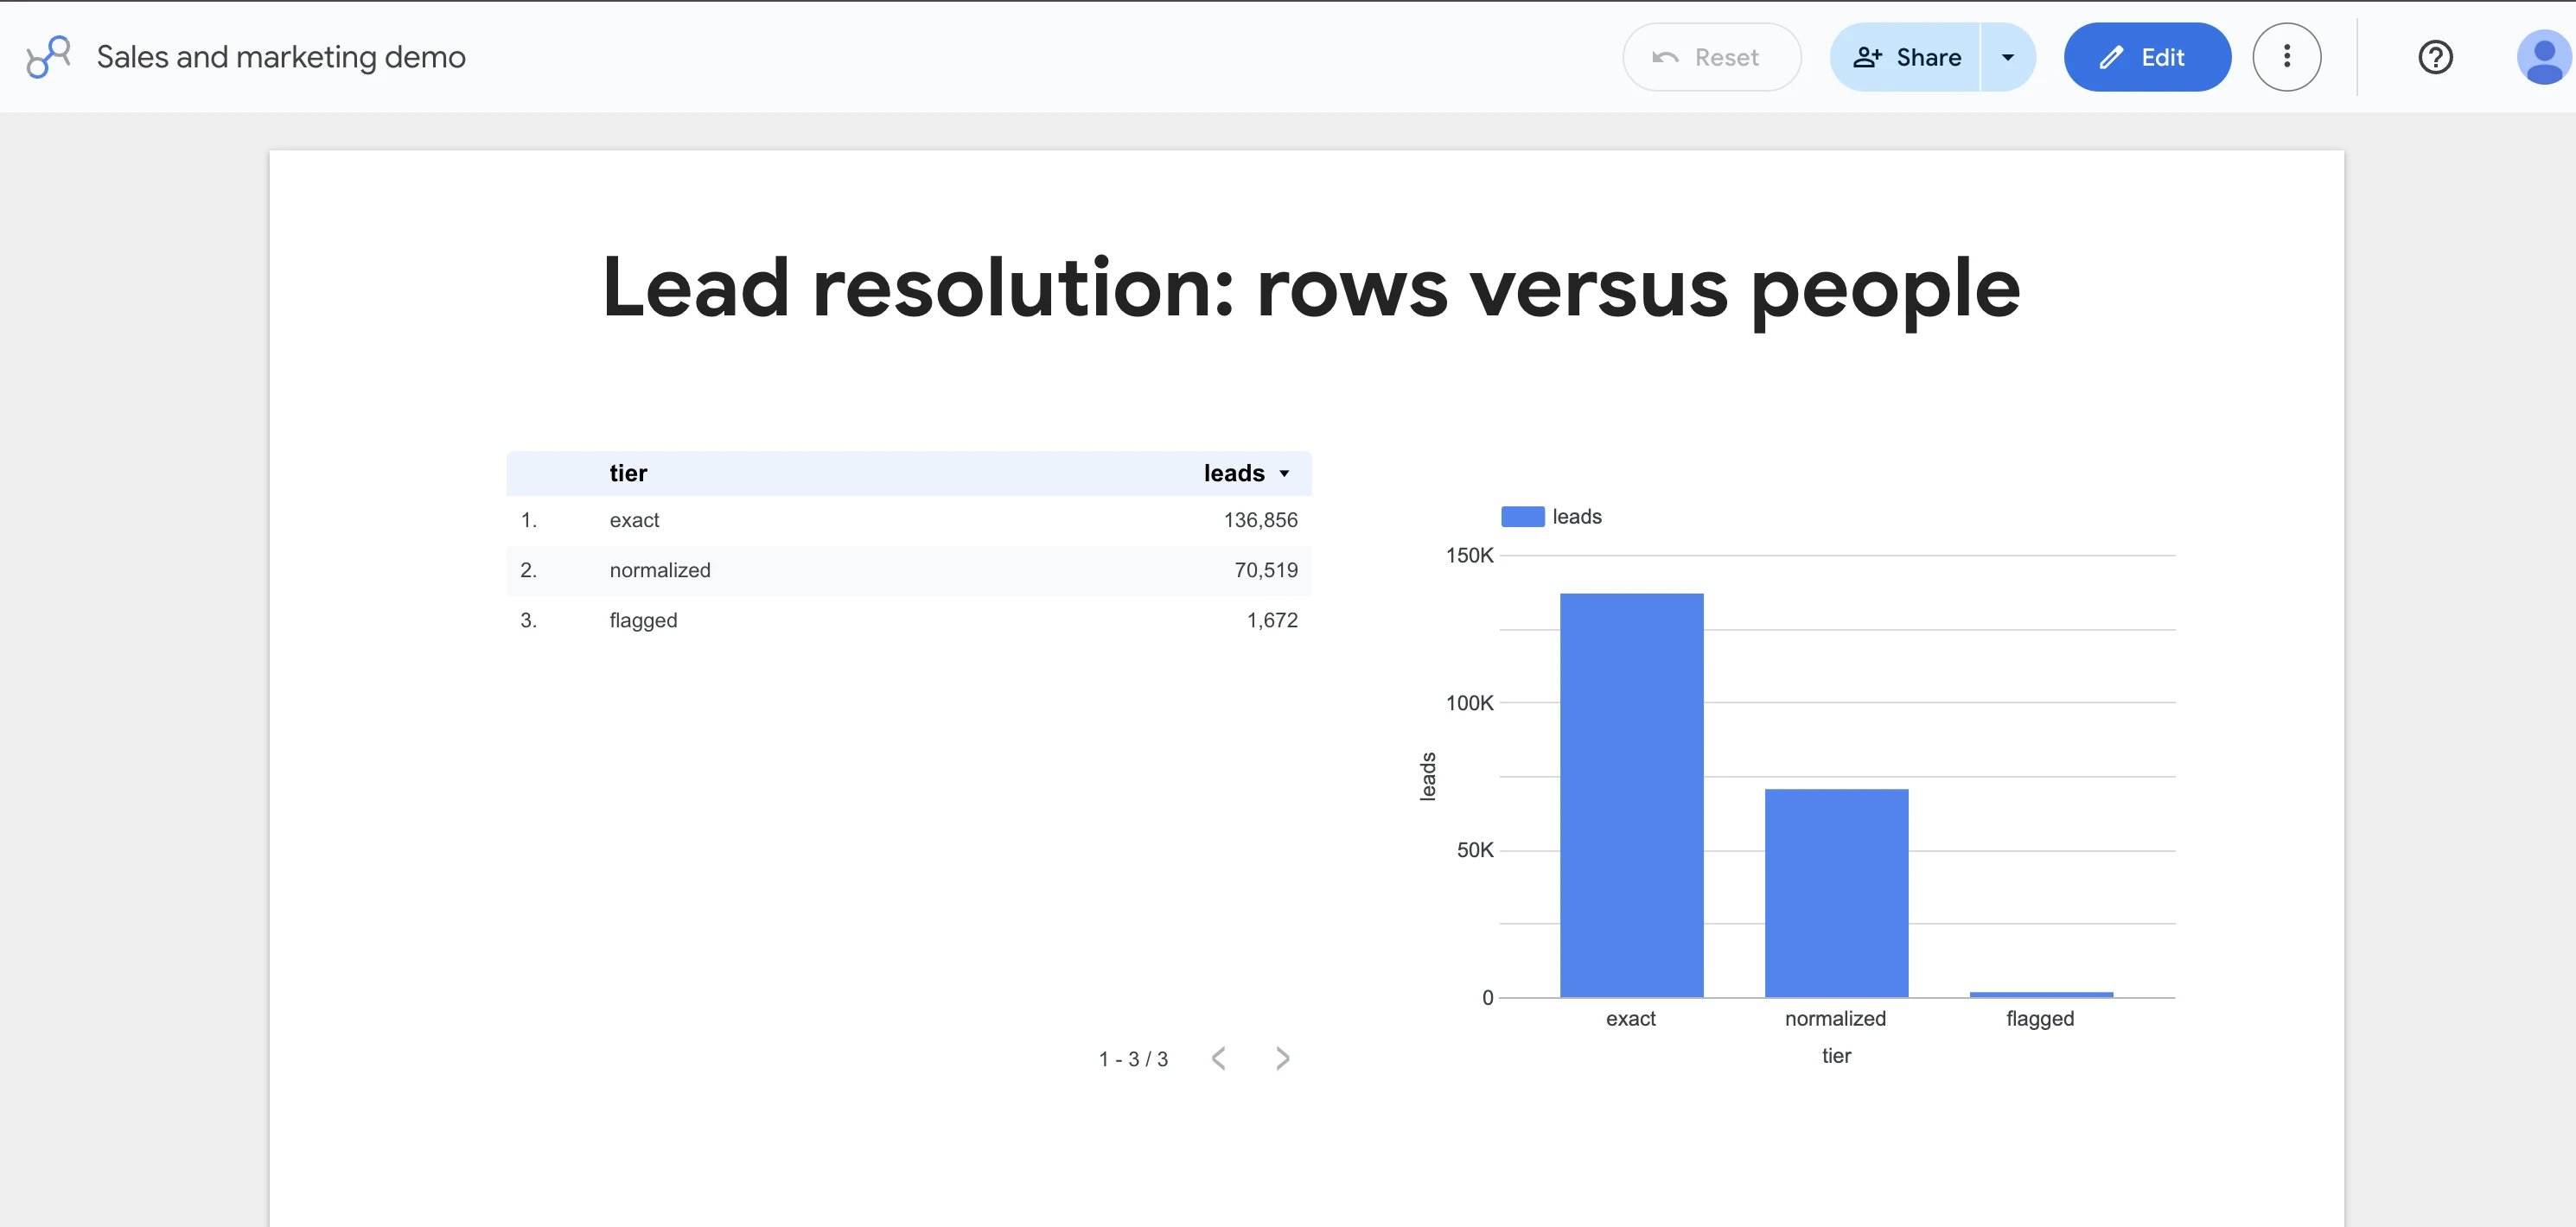
Campaign names have the same disease: 380 campaigns arrive on the web as 3,046 spellings. Joined on the raw string, search looks like it costs EUR 966 per lead. Resolved, it is EUR 56. The spend did not change. The join did.
The steps, the tiers, the cost table by channel, and the mistake I made
- Lowercase and trim. The two rules that fix most of it." Anna.Huber@Example.com " → anna.huber@example.com
- Collapse the provider's aliases. Only for providers where the rule is documented.anna.huber+optics@gmail.com → annahuber@gmail.com
- Do not repair typos. A domain one character off is a flag, not a fix.exampel.com → flagged
- Assign one key per person. Every submission and CRM row points at it.person_key
- Carry the tier. exact, normalized, or flagged, on every row, forever.136,856 exact · 70,519 normalized · 1,672 flagged
| Channel | Spend | Cost per lead, joining raw strings | Cost per lead, resolved names |
|---|---|---|---|
| Search | EUR 2,884,680 | 965.7 | 55.6 |
| Social | EUR 1,300,524 | 1,501.8 | 56.4 |
| EUR 192,418 | 2,069.0 | 57.9 | |
| Dealer event | EUR 319,548 | 995.5 | 57.8 |
| Print and QR | EUR 250,116 | 720.8 | 57.5 |
Synthetic figures. EUR.
The mistake I made. The generator built campaign names by combining a subsidiary, a theme and sometimes a model, drawn at random for 380 campaigns. Only 255 of the 380 names came out distinct. The campaign view joins on the normalized name, so every session landing on a shared name would have fanned out into two campaign rows and quietly doubled the counts in the cost table. Nothing errored. I found it by counting distinct names before trusting the join. The fix was a suffix on the repeats and a test that fails when names collide.
Then
What done means for this one problem
Why did this unit fail, and what did it cost, only becomes answerable once a pipeline can prove these six things about itself. Here is the definition the four pipelines behind this page enforce on themselves.
- It runs on a schedule and checks its own output. The last step queries the tables it just built and refuses to report success against an empty one, or against a headline number that did not move the way it must.verify: unique_people < naive_leads, or fail
- The number on the dashboard is the number in the query, and both have an owner. Every dashboard page here is a view in version control. Nobody types a figure into a slide.rpt_* views, one per page
- Every row says where it came from and who wrote it. Source system, capture method, resolution tier. The dashboard can then show the share that is guessed, which is zero, and the share that is flagged, which is not.hand · system · exact · corrected · flagged
- What the pipeline cannot recover is written down next to the number. On this page, in every scenario. A limit that is stated is a decision. One that is hidden is a future incident.
- It is safe to run twice. Reloads are idempotent, so a retry at three in the morning cannot double anything.second merge inserts 0
- The mistakes are logged. Four are on this page, with what caught them. That log is the training data for the next project.
Done is a state the pipeline can prove, not a status somebody sets. The same sentence covers the migration to an enterprise cloud setup: it is done when the old project is empty and the new one passes the same six checks.
Highest value, lowest effort
Where I would start, and why
This is how I would rank what is on this page, judged on value to production and sales against the engineering it takes.
| Scenario | Value | Effort | First data needed | Why this position |
|---|---|---|---|---|
| Capture method on every record | High | Low | One column, populated by the loader | Answers "how much by hand" on day one, and every later scenario needs it |
| Quality-control reason catalogue | High | Low | Inspection log, one export | The dashboard already exists; it needs coded reasons, not a new system |
| Serial key resolution | High | Medium | The product catalogue and two systems' serial columns | Unlocks production-to-service joins, warranty exposure, and the QC-to-field link |
| Idempotent loads with partitioning | High | Medium | One large event table | Decided at table creation; cheap to do first, expensive to retrofit |
| Lead identity resolution | Medium | Low | Form exports and a CRM extract | Restates cost per lead honestly; the rules are documented and small |
| Campaign name registry | Medium | Low | The campaign list | Collapses 3,046 spellings to 380 the day the rule ships |
| Two-ERP order reconciliation | High | High | Both feeds plus the item crosswalk | Real value, but it needs the key work above and an owner for conflicts |
| Warranty timing on the customer's clock | Medium | Medium | Registration timestamps with a zone | Money at stake, but it is a rule change with a policy question attached |
| Late-data watermarks | Medium | Low | An ingestion timestamp per row | Turns "the number changed overnight" from a mystery into a stated rule |
The pattern in the top four: they are all about keys and columns, not dashboards. That is where the low-hanging fruit is in most warehouses I have seen, including my own.
And one more thing
Where AI fits, and where it does not
Every messy input on this page is something today's models read well.
- reason text
- A free-text failure note in any language becomes a proposed reason code, with a confidence score. An inspector approves it once, then it is a rule.
- receipt
- A photo of a receipt becomes a purchase date. It enters as a claim, with a confidence score.
- engraving
- The app camera reads the serial and checks it against the catalogue on the spot.
- dealer file
- A model proposes the column mapping for an odd export. A person approves it once, then it is a rule.
AI output is one more source with a confidence score. It never writes a financial number, or a quality verdict, on its own.
That is the same rule as the rest of this page. Resolve what you can, flag what you cannot, never guess. The models are already good enough for all four of these. The question has moved from can it read this to what is it allowed to touch. That is a governance question, and this page is the governance.
How it runs
Four flows, one shape, and every one checks its own work
Each slice is a scheduled flow: generate, load into the warehouse in parallel, build the views, then query the result and refuse to report success if any table is empty or the headline number did not move the way it must. A pipeline that reports success without checking anything is the failure this whole page is about.
generate ──▶ ensure_dataset ──┬──▶ load table A ──┐
                              ├──▶ load table B ──┼──▶ build views ──▶ verify
                              └──▶ load table C ──┘
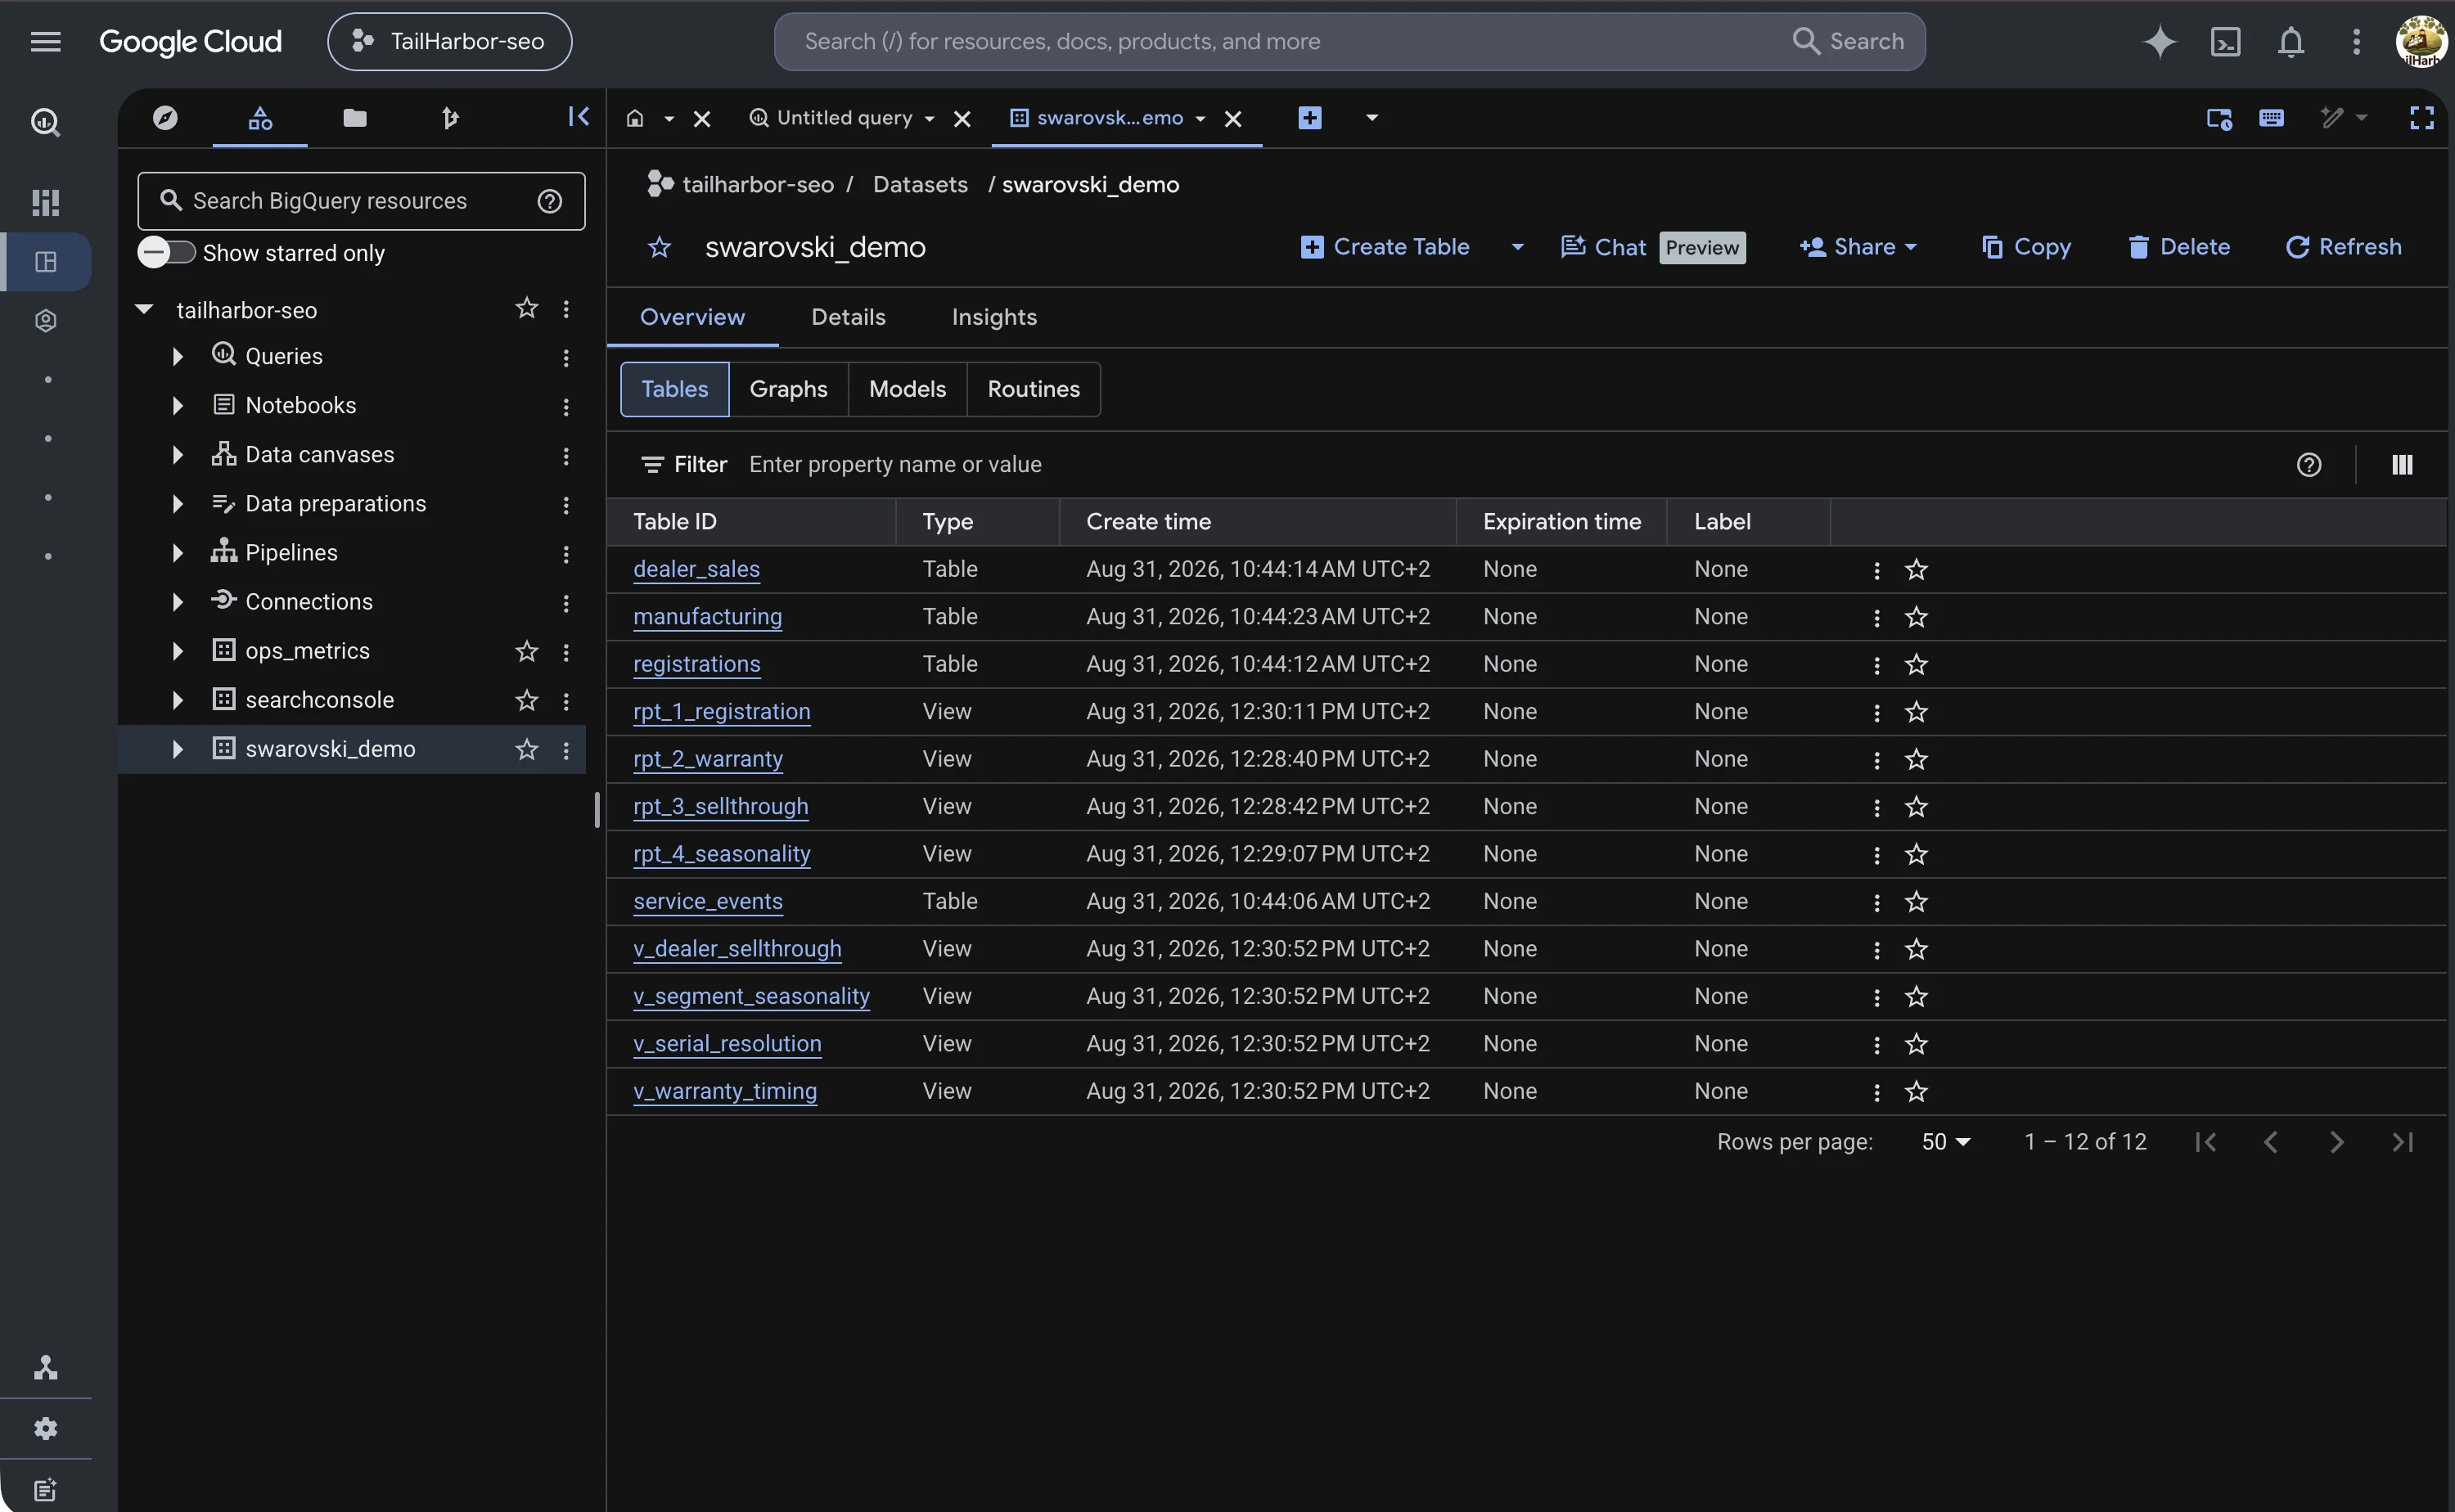
More proof: the flow runs and the other datasets
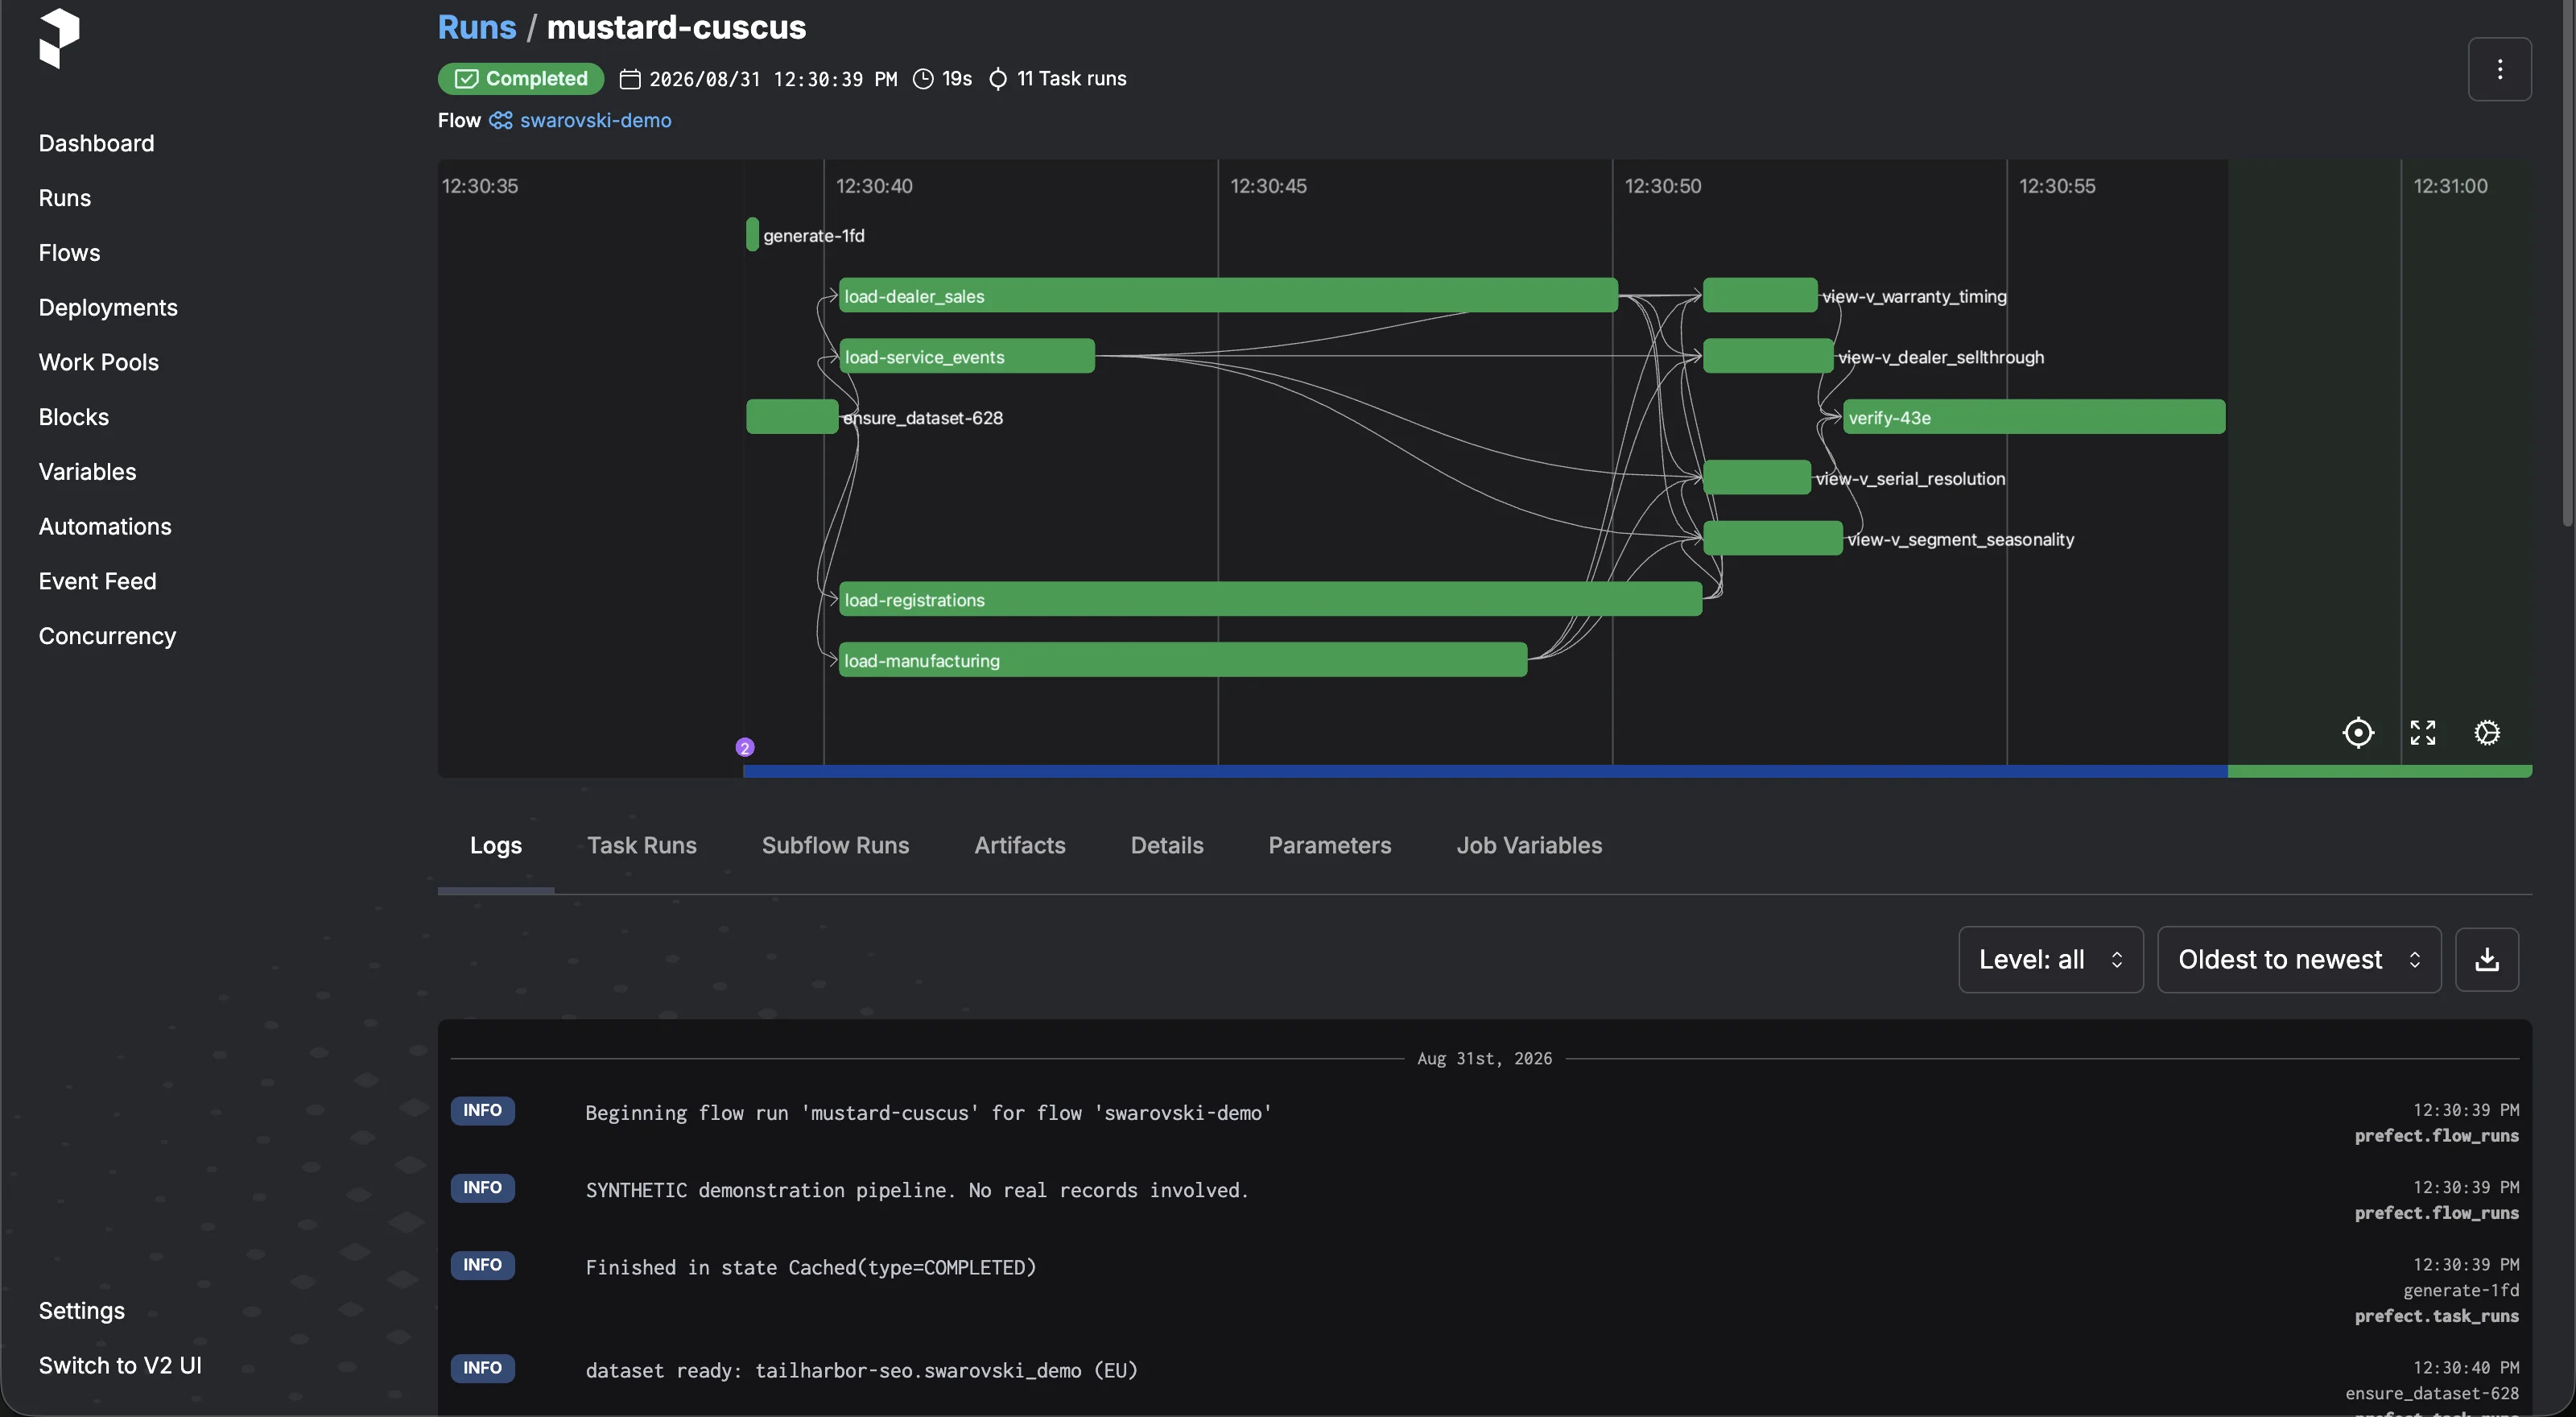
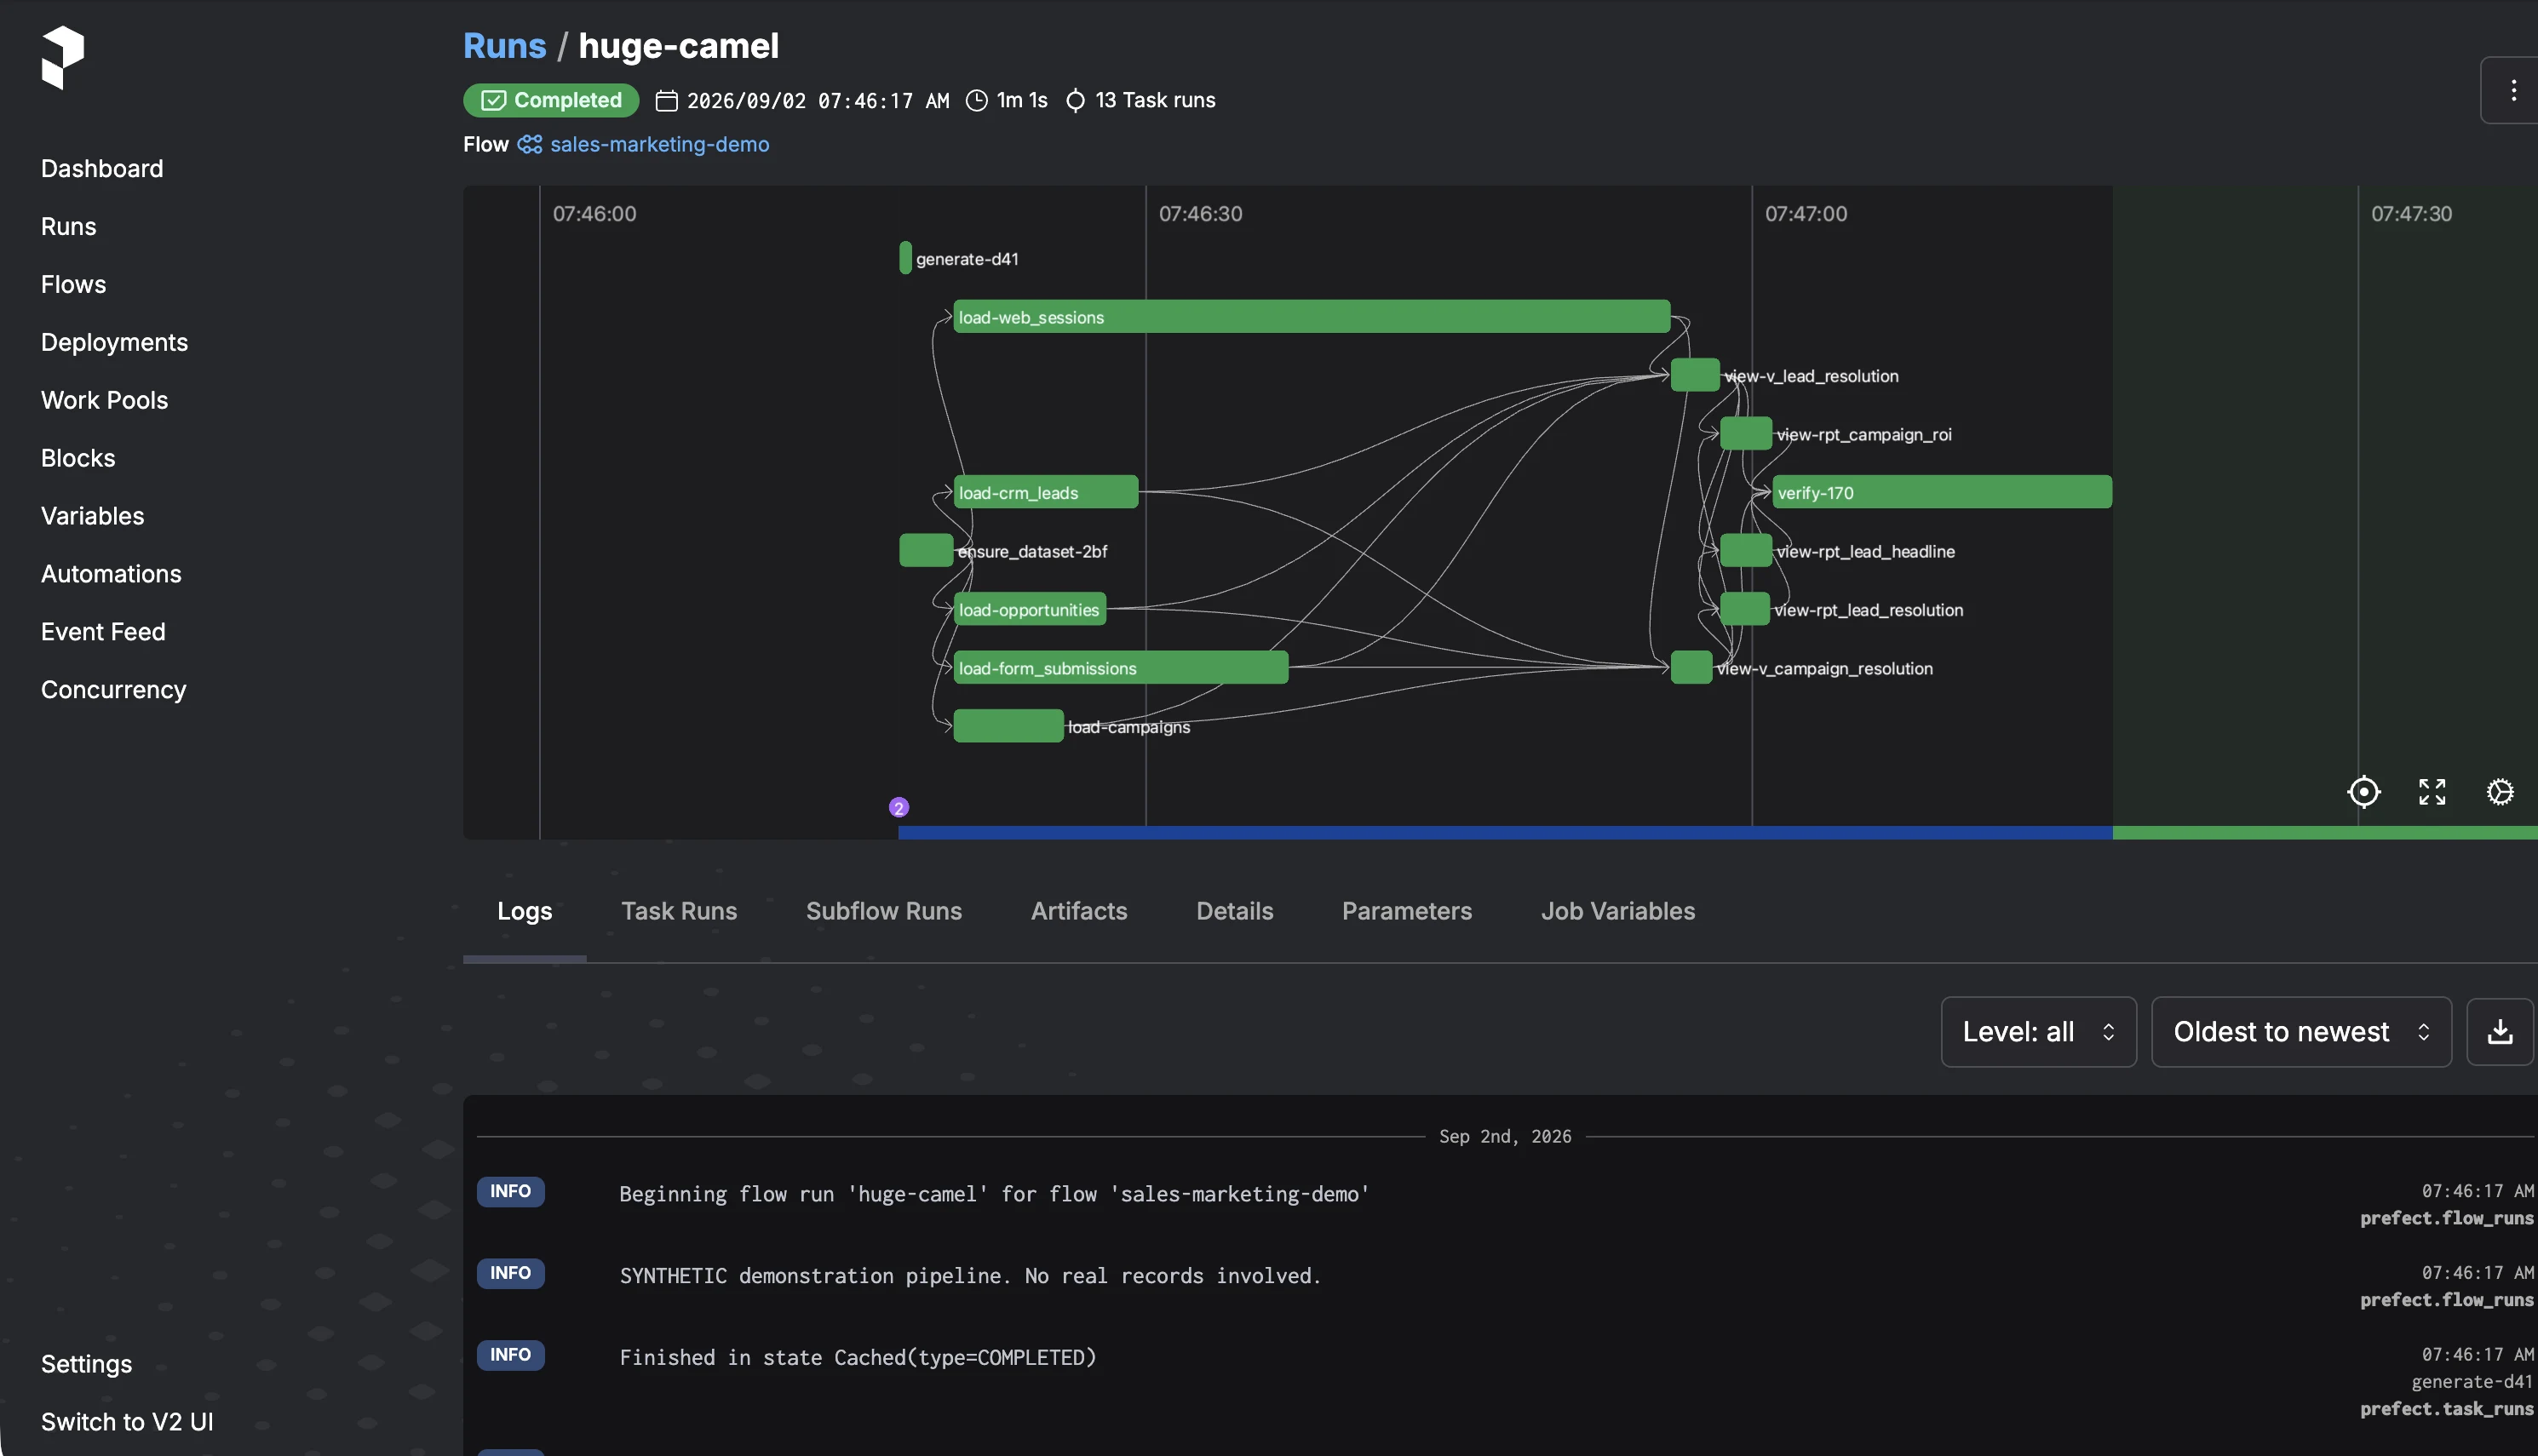
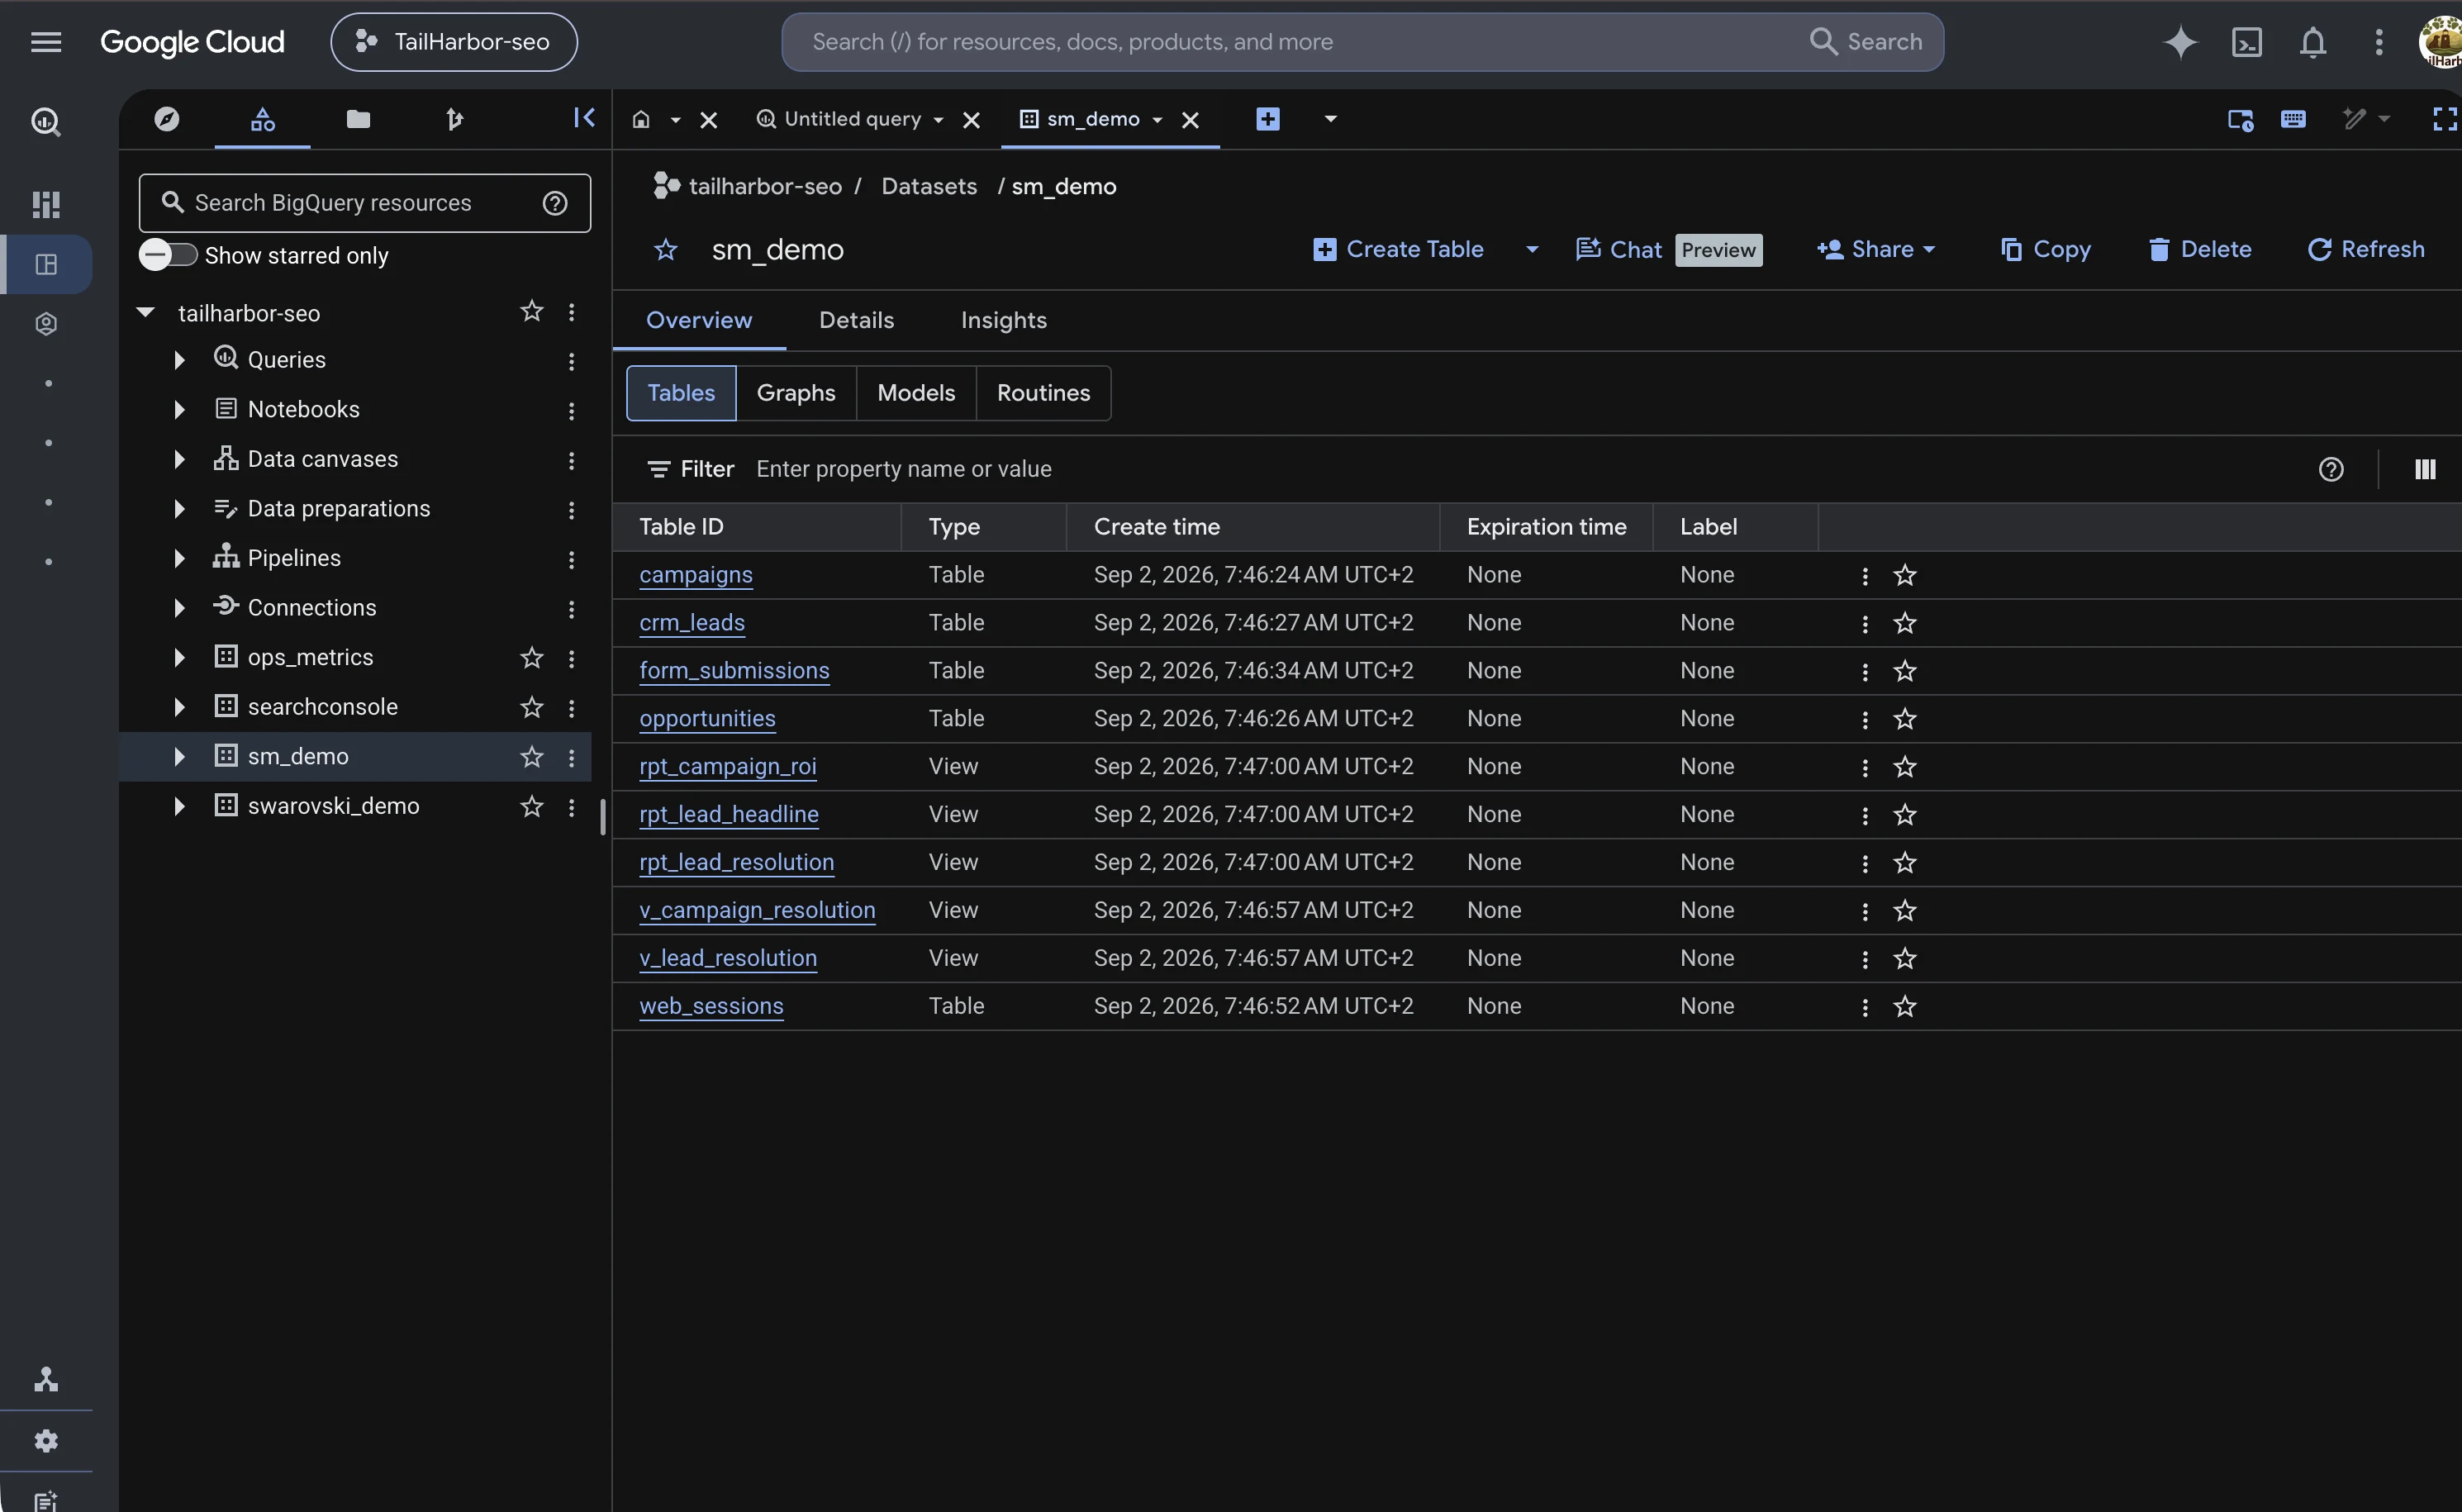
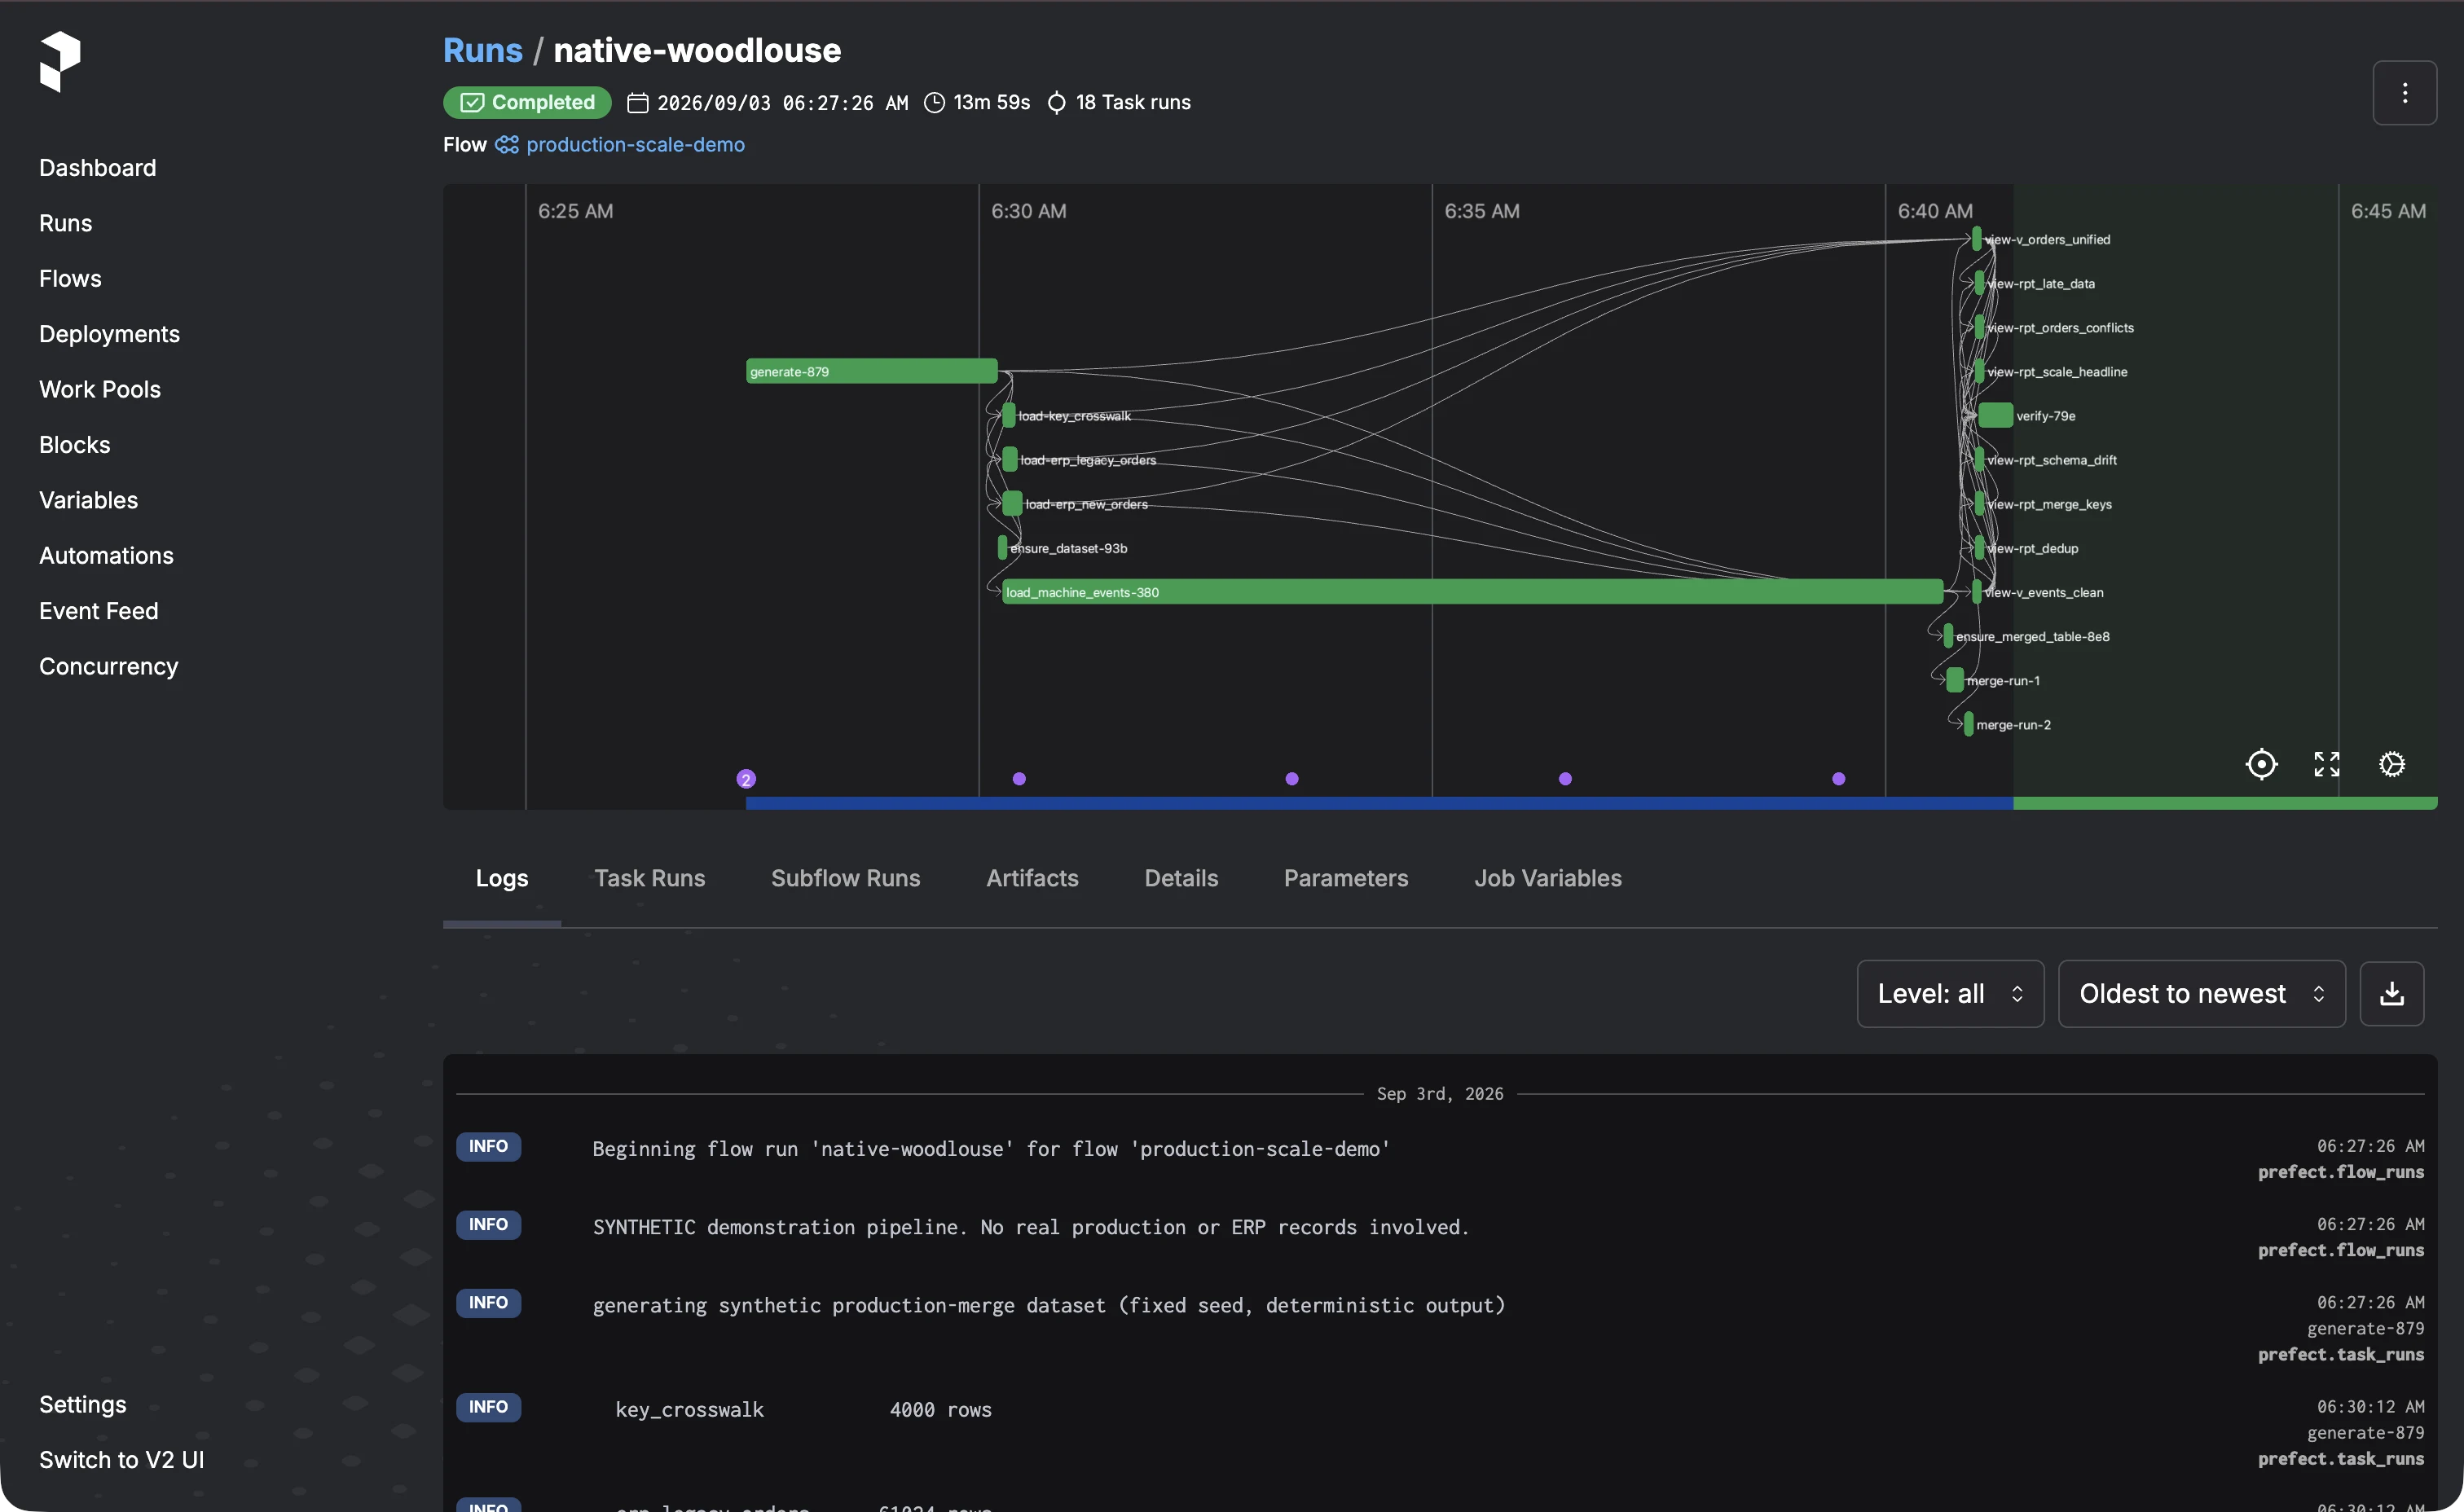
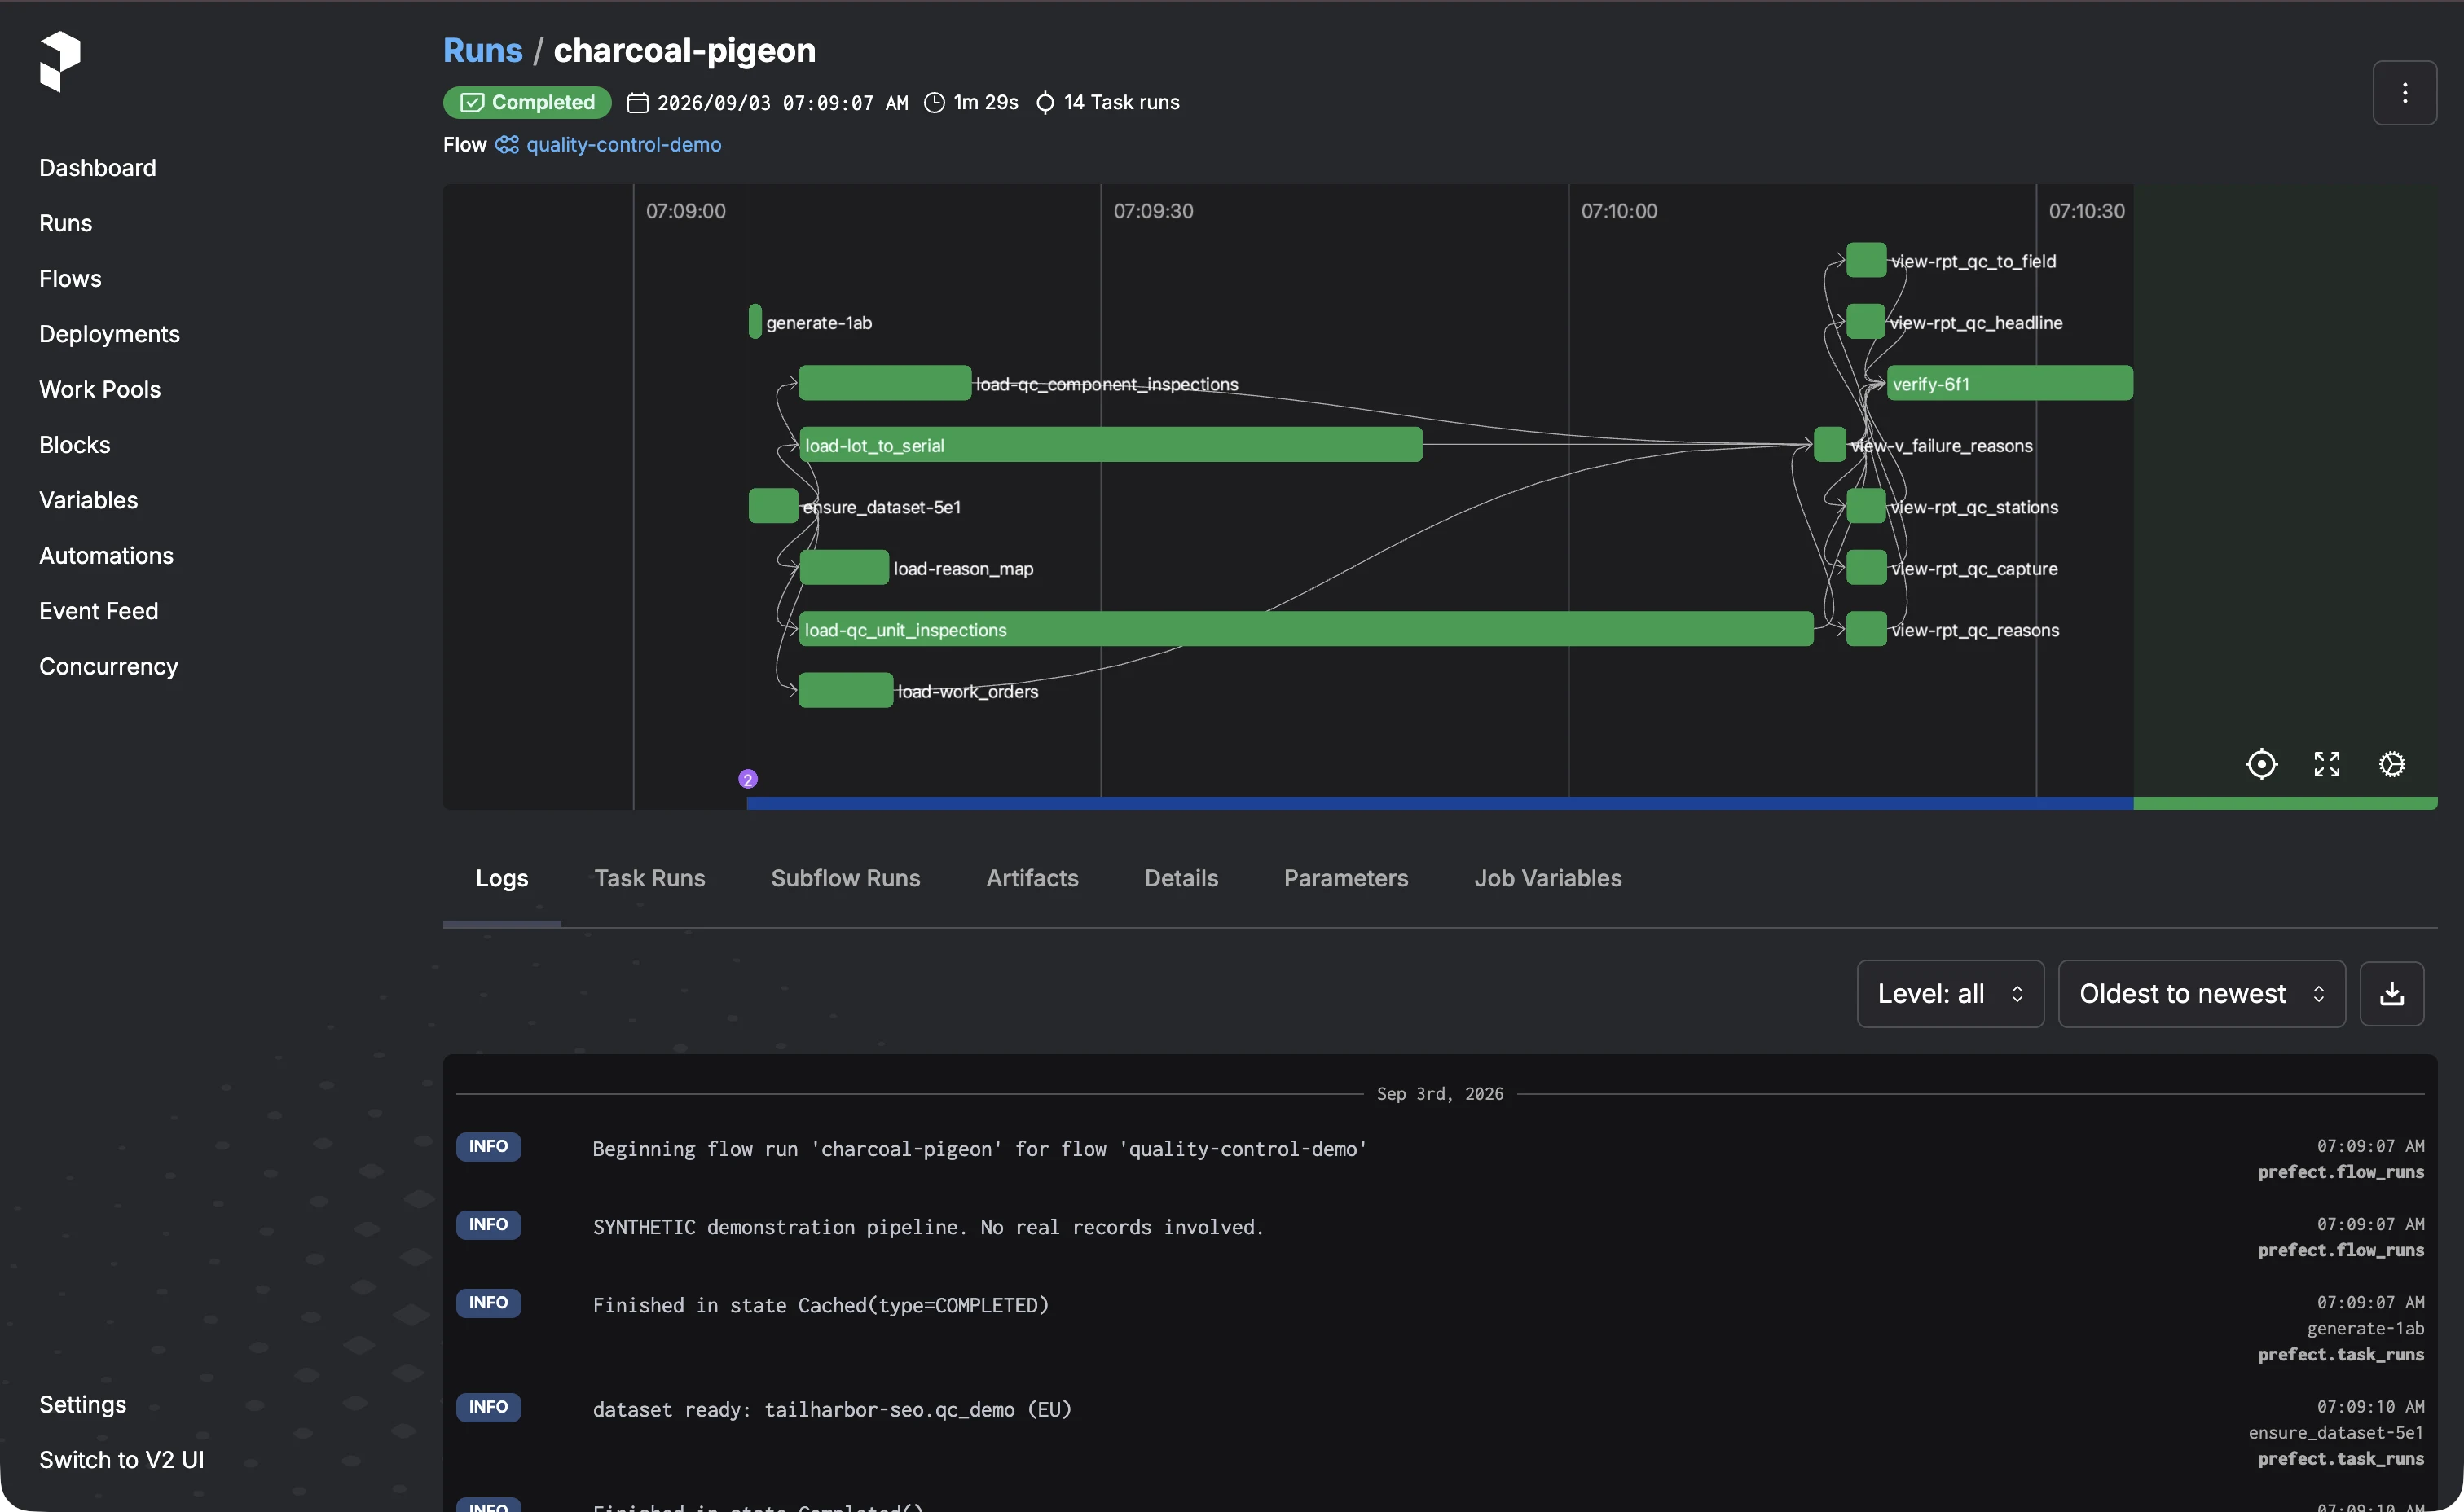
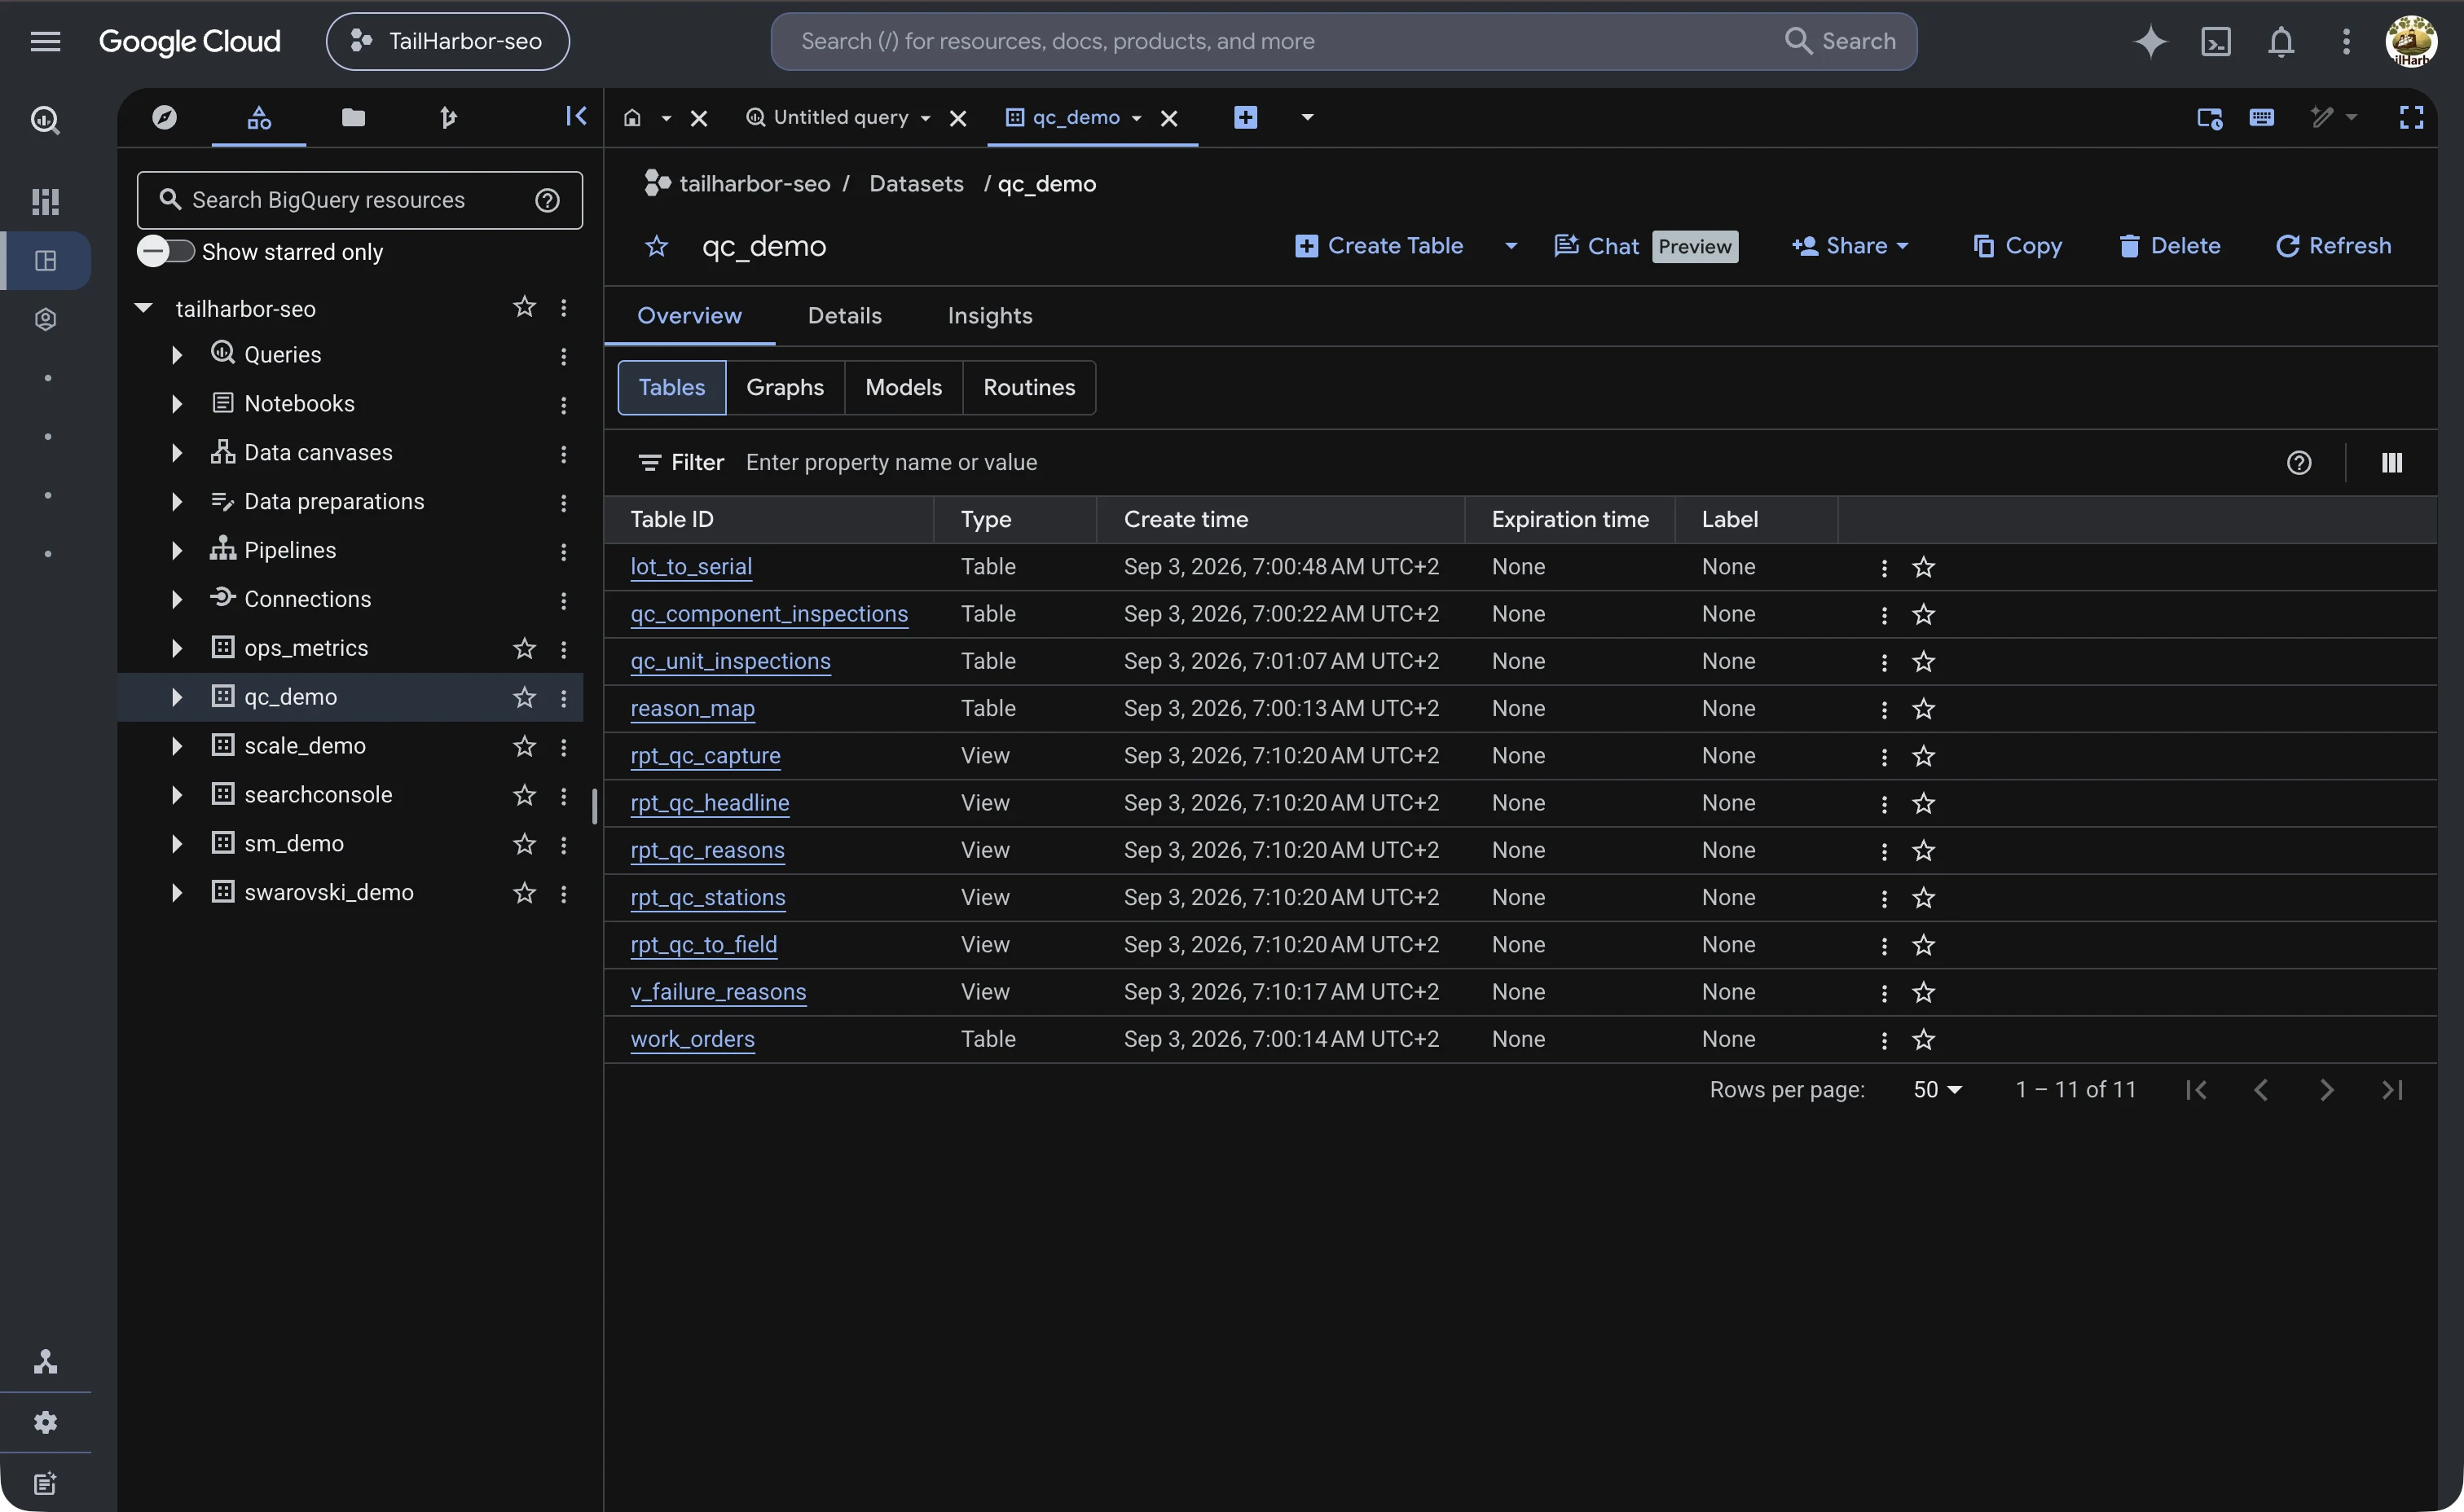
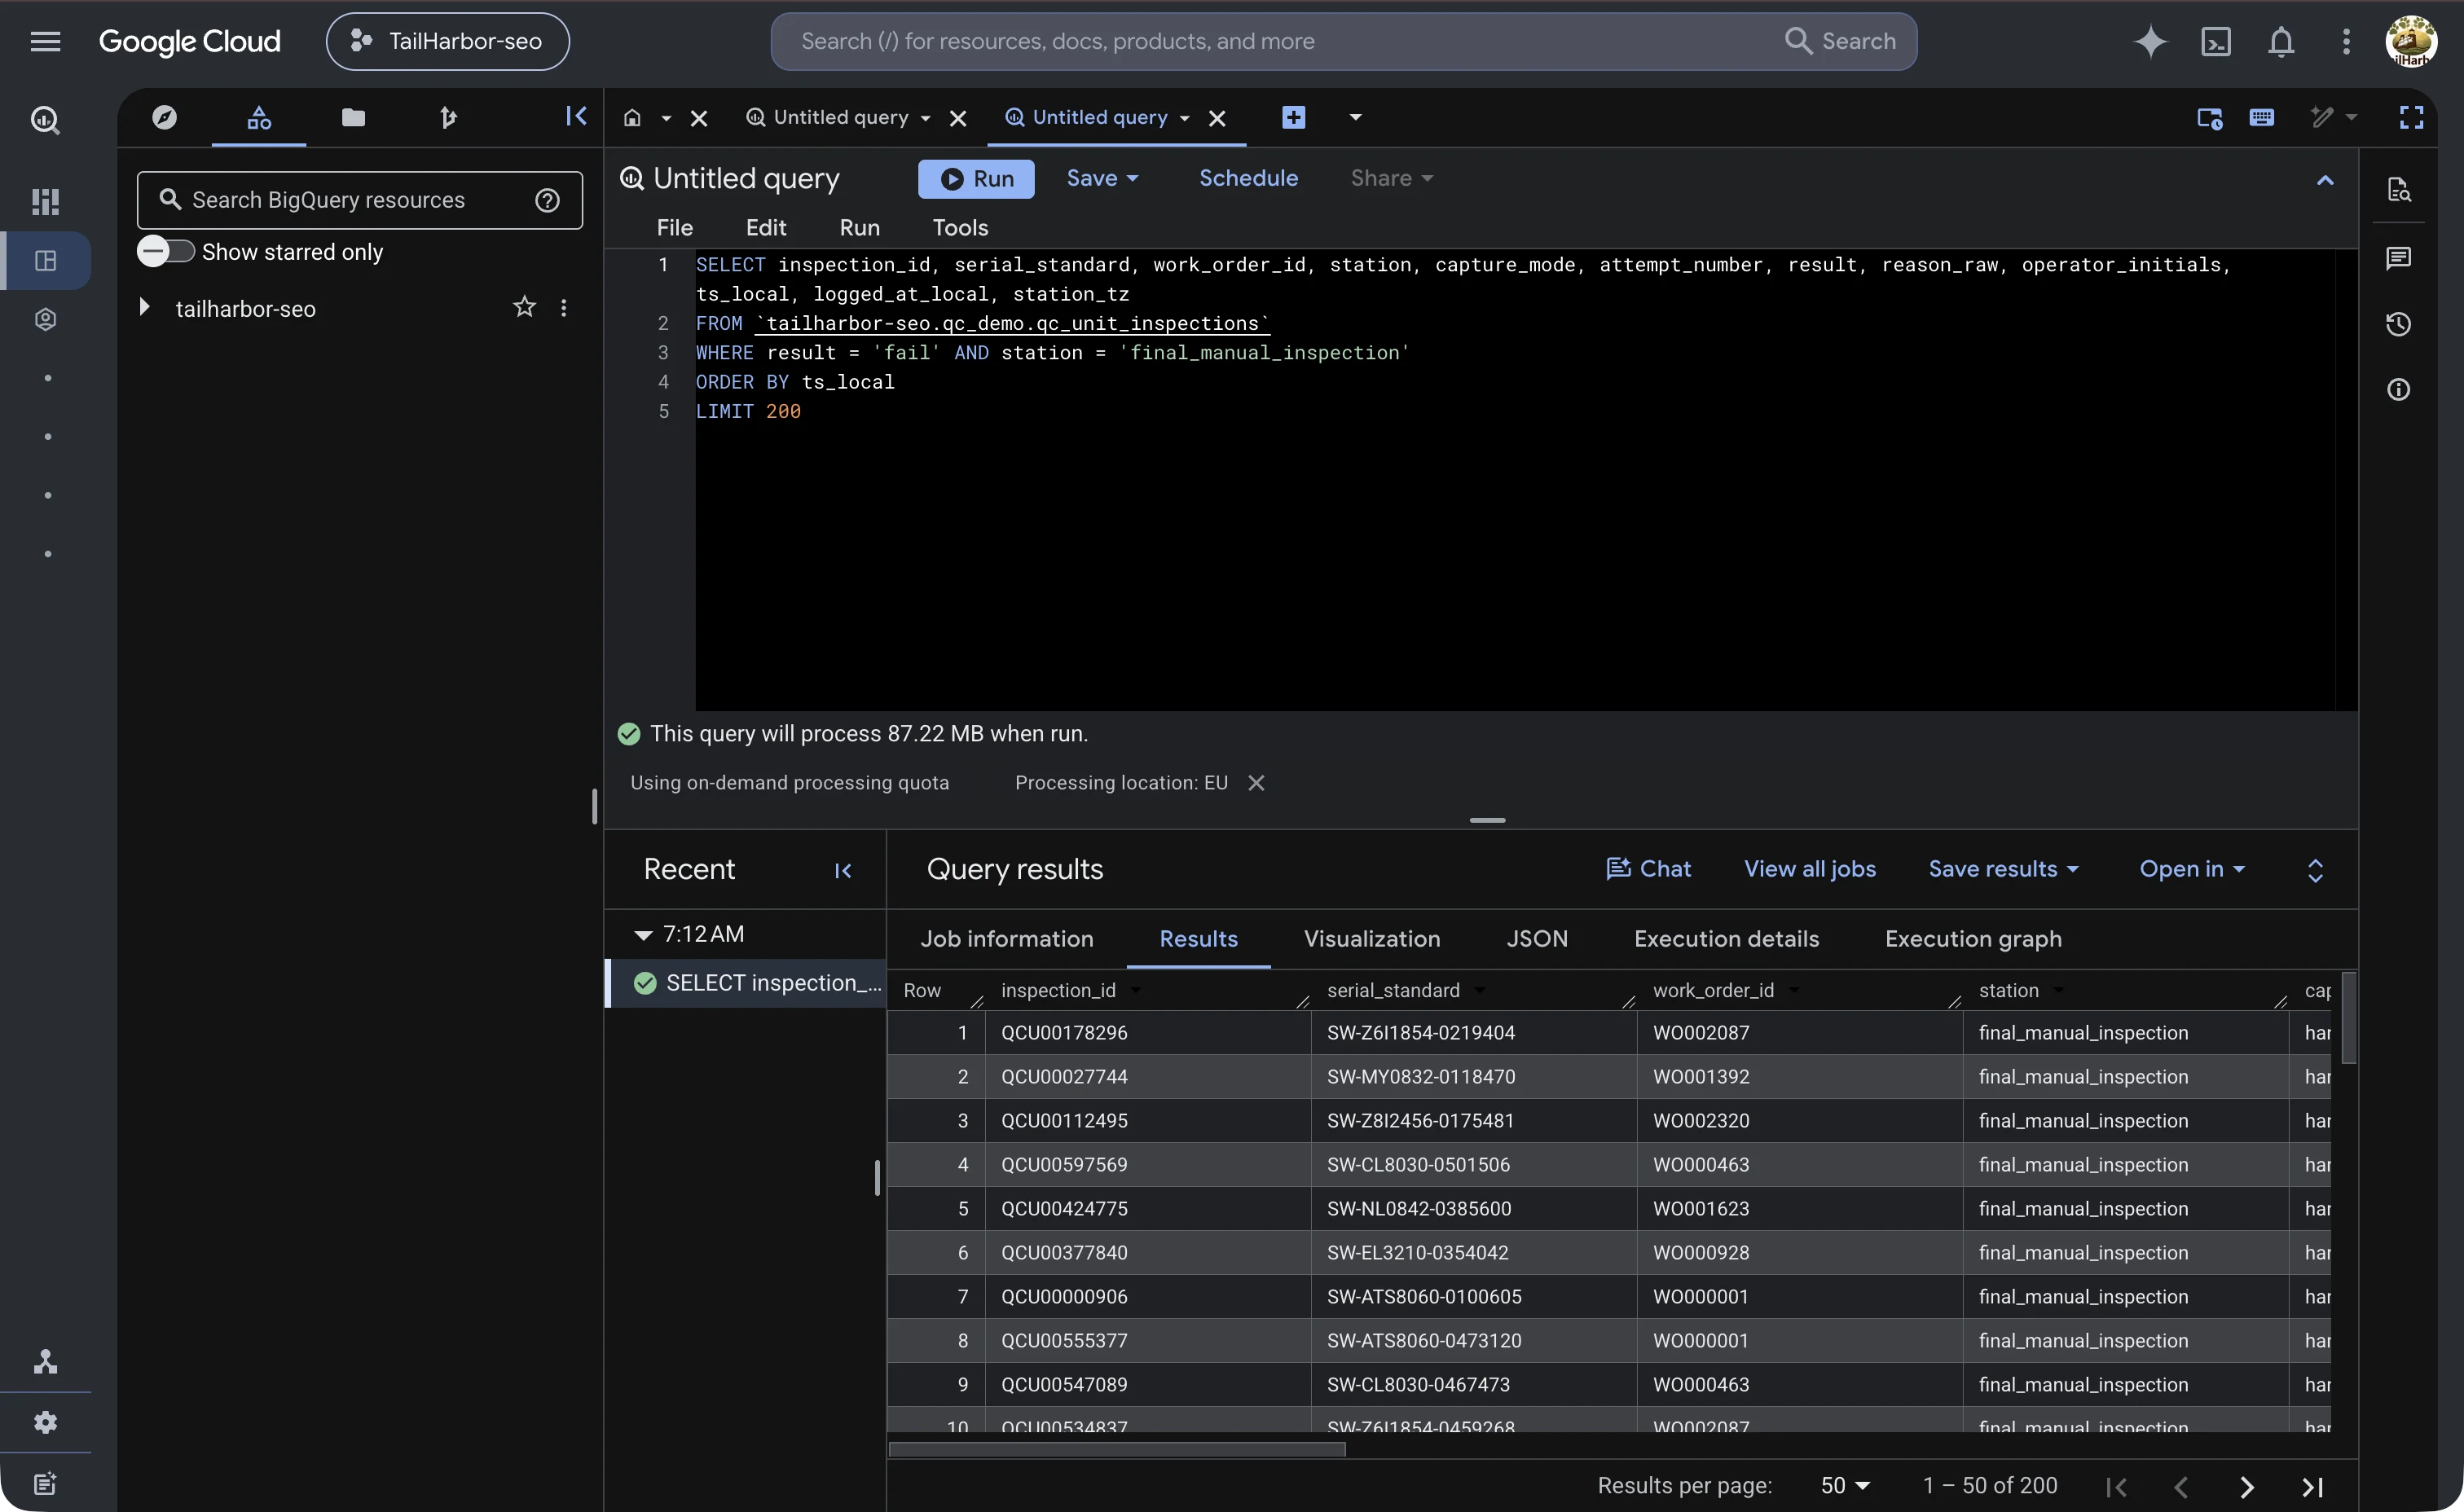
Stack: Python, Prefect, BigQuery with partitioned and clustered tables, views in version control, Terraform for the surrounding infrastructure, Looker Studio on top. Synthetic data throughout.
Appendix
Sixteen more consequences of the same problem, sketched
Sixteen more, sketched rather than built. Each is the trap and the shape of the fix.
Sketched: ten more the same data supports
- Attribution judged on the wrong clock. 80.6% of won deals close after their campaign has ended. Judge a campaign at its end date and it looks like a loss; judge it 90 days later and it is the best one. Fix: a fixed attribution window stated on the dashboard.
- The dealer handoff black hole. A lead handed to a dealer leaves the CRM and never comes back. Silence is not the same as a lost deal. Fix: a handoff record with an expected-outcome date and a report of overdue outcomes.
- Consent is a fact with a time. A marketing consent flag flips both ways. Store consent as events with timestamps and resolve the current state at send time.
- Trade fair badge scans. One email for a whole hunting club, typed on a shared tablet. Scans need their own source tier, below web forms.
- Bots and duplicates that look like conversion. Velocity and honeypot rules belong in the pipeline, with rejected rows kept and counted, not deleted.
- Bounce, unsubscribe, complaint. Three facts collapsed into one "inactive" flag. Each needs its own column, because the next action differs.
- Stages that move backwards. Snapshot the stage per day and report movement, not membership, or a regression is counted twice.
- Pipeline value in eight currencies. Store the local amount, the rate and the rate date, and let the report choose the date.
- Product interest in two vocabularies. The web form says "binoculars, 10x42"; the CRM says a model code. Same catalogue lookup as the serials, with a flagged tier.
- The form field that changed. Remove one field and every lead score drops silently. Measure what arrived, not what was expected, and alert on a column going quiet.
Sketched: six more on the product side
- Duplicate registrations are families, not errors. 2,521 units carry more than one registration. Some are typos, some are resales and gifts. The fix is a policy question dressed as a dedupe: which registration owns the warranty, and does the second one start a new relationship or inherit the old one.
- Service with no registration behind it. Units surface in service years after sale with no registration anywhere. The join gives you nothing, and nothing is not evidence of nothing. The shape of the fix: a provisional identity created at the service desk, reconciled later against dealer and registration records.
- The unit that crossed a border. Sold by a dealer in one country, registered in a second, serviced in a third. Warranty terms and subsidiaries differ by region, so the pipeline needs one answer to "whose customer is this," with the disagreement flagged rather than silently resolved by whichever system wrote last.
- The serial that sold twice. A return that goes back on the shelf appears in sell-through twice, honestly, months apart. Counting it twice inflates demand; dropping it hides the return rate. The fix is a sale-pair rule: same serial, same channel, opposite directions, within a window.
- Recall tracing against the contact gap. A defective manufacturing batch is easy to identify and hard to act on when 71.8% of owners have no contact path. The scenario is the join from batch to reachable human, and the honest output is three lists: contactable, findable via a dealer, unreachable.
- Closing a month that is still arriving. With channels reporting up to 61 days late, any monthly close is a bet. The fix is a watermark: publish the month with its expected completeness attached, restate on a fixed schedule, and never let a restated number overwrite its history silently.